Spaces:
Running

Running
| #import module | |
| import streamlit as st | |
| from PIL import Image | |
| #===config=== | |
| st.set_page_config( | |
| page_title="Coconut", | |
| page_icon="🥥", | |
| layout="wide", | |
| initial_sidebar_state="collapsed" | |
| ) | |
| hide_streamlit_style = """ | |
| <style> | |
| #MainMenu | |
| {visibility: hidden;} | |
| footer {visibility: hidden;} | |
| [data-testid="collapsedControl"] {display: none} | |
| </style> | |
| """ | |
| st.markdown(hide_streamlit_style, unsafe_allow_html=True) | |
| st.title('🥥 Coconut Libtool', anchor=False) | |
| #===page=== | |
| mt1, mt2 = st.tabs(["Menu", "How to"]) | |
| with mt1: | |
| col1, col2, col3 = st.columns(3) | |
| with col1.container(border=True): | |
| st.markdown("") | |
| if st.button("Go to Keywords Stem"): | |
| st.switch_page("pages/6 Keywords Stem.py") | |
| with col2.container(border=True): | |
| st.markdown("") | |
| if st.button("Go to Topic Modeling"): | |
| st.switch_page("pages/2 Topic Modeling.py") | |
| with col3.container(border=True): | |
| st.markdown("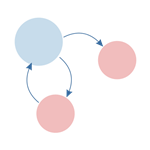") | |
| if st.button("Go to Bidirected Network"): | |
| st.switch_page("pages/3 Bidirected Network.py") | |
| with col1.container(border=True): | |
| st.markdown("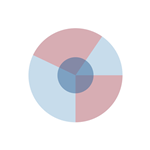") | |
| if st.button("Go to Sunburst Visualization"): | |
| st.switch_page("pages/4 Sunburst.py") | |
| with col2.container(border=True): | |
| st.markdown("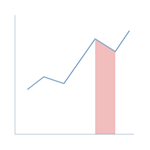") | |
| if st.button("Go to Burst Detection"): | |
| st.switch_page("pages/5 Burst Detection.py") | |
| with col3.container(border=True): | |
| st.markdown("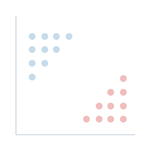") | |
| if st.button("Go to Scattertext"): | |
| st.switch_page("pages/1 Scattertext.py") | |
| with mt2: | |
| st.header("Before you start", anchor=False) | |
| option = st.selectbox( | |
| 'Please choose....', | |
| ('Keyword Stem', 'Topic Modeling', 'Bidirected Network', 'Sunburst', 'Burst Detection', 'Scattertext')) | |
| if option == 'Keyword Stem': | |
| tab1, tab2, tab3, tab4 = st.tabs(["Prologue", "Steps", "Requirements", "Download Result"]) | |
| with tab1: | |
| st.write("This approach is effective for locating basic words and aids in catching the true meaning of the word, which can lead to improved semantic analysis and comprehension of the text. Some people find it difficult to check keywords before performing bibliometrics (using software such as VOSviewer and Bibliometrix). This strategy makes it easy to combine and search for fundamental words from keywords, especially if you have a large number of keywords. To do stemming or lemmatization on other text, change the column name to 'Keyword' in your file.") | |
| st.divider() | |
| st.write('💡 The idea came from this:') | |
| st.write('Santosa, F. A. (2022). Prior steps into knowledge mapping: Text mining application and comparison. Issues in Science and Technology Librarianship, 102. https://doi.org/10.29173/istl2736') | |
| with tab2: | |
| st.text("1. Put your file.") | |
| st.text("2. Choose your preferable method. Picture below may help you to choose wisely.") | |
| st.markdown("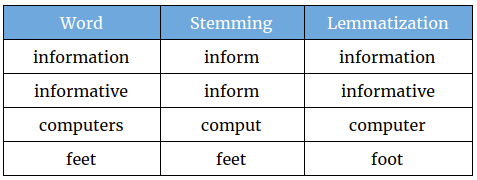") | |
| st.text('Source: https://studymachinelearning.com/stemming-and-lemmatization/') | |
| st.text("3. Now you need to select what kind of keywords you need.") | |
| st.text("4. Finally, you can download and use the file on VOSviewer, Bibliometrix, or put it on OpenRefine to get better result!") | |
| st.error("Please check what has changed. It's possible some keywords failed to find their roots.", icon="🚨") | |
| with tab3: | |
| st.text(""" | |
| +----------------+------------------------+---------------------------------+ | |
| | Source | File Type | Column | | |
| +----------------+------------------------+---------------------------------+ | |
| | Scopus | Comma-separated values | Author Keywords | | |
| | | (.csv) | Index Keywords | | |
| +----------------+------------------------+---------------------------------+ | |
| | Web of Science | Tab delimited file | Author Keywords | | |
| | | (.txt) | Keywords Plus | | |
| +----------------+------------------------+---------------------------------+ | |
| | Lens.org | Comma-separated values | Keywords (Scholarly Works) | | |
| | | (.csv) | | | |
| +----------------+------------------------+---------------------------------+ | |
| | Other | .csv | Change your column to 'Keyword' | | |
| +----------------+------------------------+---------------------------------+ | |
| """) | |
| with tab4: | |
| st.subheader(':blue[Result]', anchor=False) | |
| st.button('Press to download result 👈') | |
| st.text("Go to Result and click Download button.") | |
| st.divider() | |
| st.subheader(':blue[List of Keywords]', anchor=False) | |
| st.button('Press to download keywords 👈') | |
| st.text("Go to List of Keywords and click Download button.") | |
| elif option == 'Topic Modeling': | |
| tab1, tab2, tab3, tab4 = st.tabs(["Prologue", "Steps", "Requirements", "Download Visualization"]) | |
| with tab1: | |
| st.write("Topic modeling has numerous advantages for librarians in different aspects of their work. A crucial benefit is an ability to quickly organize and categorize a huge volume of textual content found in websites, institutional archives, databases, emails, and reference desk questions. Librarians can use topic modeling approaches to automatically identify the primary themes or topics within these documents, making navigating and retrieving relevant information easier. Librarians can identify and understand the prevailing topics of discussion by analyzing text data with topic modeling tools, allowing them to assess user feedback, tailor their services to meet specific needs and make informed decisions about collection development and resource allocation. Making ontologies, automatic subject classification, recommendation services, bibliometrics, altmetrics, and better resource searching and retrieval are a few examples of topic modeling. To do topic modeling on other text like chats and surveys, change the column name to 'Abstract' in your file.") | |
| st.divider() | |
| st.write('💡 The idea came from this:') | |
| st.write('Lamba, M., & Madhusudhan, M. (2021, July 31). Topic Modeling. Text Mining for Information Professionals, 105–137. https://doi.org/10.1007/978-3-030-85085-2_4') | |
| with tab2: | |
| st.text("1. Put your file. Choose your preferred column.") | |
| st.text("2. Choose your preferred method. LDA is the most widely used, whereas Biterm is appropriate for short text, and BERTopic works well for large text data as well as supports more than 50+ languages.") | |
| st.text("3. Finally, you can visualize your data.") | |
| st.error("This app includes lemmatization and stopwords for the abstract text. Currently, we only offer English words.", icon="💬") | |
| with tab3: | |
| st.text(""" | |
| +----------------+------------------------+----------------------------------+ | |
| | Source | File Type | Column | | |
| +----------------+------------------------+----------------------------------+ | |
| | Scopus | Comma-separated values | Choose your preferred column | | |
| | | (.csv) | that you have | | |
| +----------------+------------------------| | | |
| | Web of Science | Tab delimited file | | | |
| | | (.txt) | | | |
| +----------------+------------------------| | | |
| | Lens.org | Comma-separated values | | | |
| | | (.csv) | | | |
| +----------------+------------------------| | | |
| | Other | .csv | | | |
| +----------------+------------------------+----------------------------------+ | |
| """) | |
| with tab4: | |
| st.subheader(':blue[pyLDA]', anchor=False) | |
| st.button('Download image') | |
| st.text("Click Download Image button.") | |
| st.divider() | |
| st.subheader(':blue[Biterm]', anchor=False) | |
| st.text("Click the three dots at the top right then select the desired format.") | |
| st.markdown("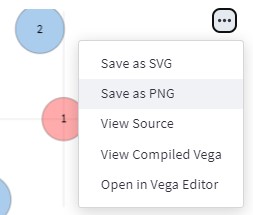") | |
| st.divider() | |
| st.subheader(':blue[BERTopic]', anchor=False) | |
| st.text("Click the camera icon on the top right menu") | |
| st.markdown("") | |
| elif option == 'Bidirected Network': | |
| tab1, tab2, tab3, tab4 = st.tabs(["Prologue", "Steps", "Requirements", "Download Graph"]) | |
| with tab1: | |
| st.write("The use of network text analysis by librarians can be quite beneficial. Finding hidden correlations and connections in textual material is a significant advantage. Using network text analysis tools, librarians can improve knowledge discovery, obtain deeper insights, and support scholars meaningfully, ultimately enhancing the library's services and resources. This menu provides a two-way relationship instead of the general network of relationships to enhance the co-word analysis. Since it is based on ARM, you may obtain transactional data information using this menu. Please name the column in your file 'Keyword' instead.") | |
| st.divider() | |
| st.write('💡 The idea came from this:') | |
| st.write('Santosa, F. A. (2023). Adding Perspective to the Bibliometric Mapping Using Bidirected Graph. Open Information Science, 7(1), 20220152. https://doi.org/10.1515/opis-2022-0152') | |
| with tab2: | |
| st.text("1. Put your file.") | |
| st.text("2. Choose your preferable method. Picture below may help you to choose wisely.") | |
| st.markdown("") | |
| st.text('Source: https://studymachinelearning.com/stemming-and-lemmatization/') | |
| st.text("3. Choose the value of Support and Confidence. If you're not sure how to use it please read the article above or just try it!") | |
| st.text("4. You can see the table and a simple visualization before making a network visualization.") | |
| st.text('5. Click "Generate network visualization" to see the network') | |
| st.error("The more data on your table, the more you'll see on network.", icon="🚨") | |
| st.error("If the table contains many rows, the network will take more time to process. Please use it efficiently.", icon="⌛") | |
| with tab3: | |
| st.text(""" | |
| +----------------+------------------------+---------------------------------+ | |
| | Source | File Type | Column | | |
| +----------------+------------------------+---------------------------------+ | |
| | Scopus | Comma-separated values | Author Keywords | | |
| | | (.csv) | Index Keywords | | |
| +----------------+------------------------+---------------------------------+ | |
| | Web of Science | Tab delimited file | Author Keywords | | |
| | | (.txt) | Keywords Plus | | |
| +----------------+------------------------+---------------------------------+ | |
| | Lens.org | Comma-separated values | Keywords (Scholarly Works) | | |
| | | (.csv) | | | |
| +----------------+------------------------+---------------------------------+ | |
| | Other | .csv | Change your column to 'Keyword' | | |
| | | | and separate the words with ';' | | |
| +----------------+------------------------+---------------------------------+ | |
| """) | |
| with tab4: | |
| st.subheader(':blue[Bidirected Network]', anchor=False) | |
| st.text("Zoom in, zoom out, or shift the nodes as desired, then right-click and select Save image as ...") | |
| st.markdown("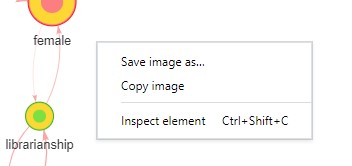") | |
| elif option == 'Sunburst': | |
| tab1, tab2, tab3, tab4 = st.tabs(["Prologue", "Steps", "Requirements", "Download Visualization"]) | |
| with tab1: | |
| st.write("Sunburst's ability to present a thorough and intuitive picture of complex hierarchical data is an essential benefit. Librarians can easily browse and grasp the relationships between different levels of the hierarchy by employing sunburst visualizations. Sunburst visualizations can also be interactive, letting librarians and users drill down into certain categories or subcategories for further information. This interactive and visually appealing depiction improves the librarian's understanding of the collection and provides users with an engaging and user-friendly experience, resulting in improved information retrieval and decision-making.") | |
| with tab2: | |
| st.text("1. Put your Scopus CSV file.") | |
| st.text("2. You can set the range of years to see how it changed.") | |
| st.text("3. The sunburst has 3 levels. The inner circle is the type of data, meanwhile, the middle is the source title and the outer is the year the article was published.") | |
| st.text("4. The size of the slice depends on total documents. The average of inner and middle levels is calculated by formula below:") | |
| st.code('avg = sum(a * weights) / sum(weights)', language='python') | |
| with tab3: | |
| st.text(""" | |
| +----------------+------------------------+--------------------+ | |
| | Source | File Type | Column | | |
| +----------------+------------------------+--------------------+ | |
| | Scopus | Comma-separated values | Source title, | | |
| | | (.csv) | Document Type, | | |
| +----------------+------------------------| Cited by, Year | | |
| | Web of Science | Tab delimited file | | | |
| | | (.txt) | | | |
| +----------------+------------------------+--------------------+ | |
| | Lens.org | Comma-separated values | Publication Year, | | |
| | | (.csv) | Publication Type, | | |
| | | | Source Title, | | |
| | | | Citing Works Count | | |
| +----------------+------------------------+--------------------+ | |
| """) | |
| with tab4: | |
| st.subheader(':blue[Sunburst]', anchor=False) | |
| st.text("Click the camera icon on the top right menu") | |
| st.markdown("") | |
| elif option == 'Burst Detection': | |
| tab1, tab2, tab3, tab4 = st.tabs(["Prologue", "Steps", "Requirements", "Download Visualization"]) | |
| with tab1: | |
| st.write("Burst detection identifies periods when a specific event occurs with unusually high frequency, referred to as 'bursty'. This method can be applied to identify bursts in a continuous stream of events or in discrete groups of events (such as poster title submissions to an annual conference).") | |
| st.divider() | |
| st.write('💡 The idea came from this:') | |
| st.write('Kleinberg, J. (2002). Bursty and hierarchical structure in streams. Knowledge Discovery and Data Mining. https://doi.org/10.1145/775047.775061') | |
| with tab2: | |
| st.text("1. Put your file. Choose your preferred column to analyze.") | |
| st.text("2. Choose your preferred method to count the words and decide how many top words you want to include or remove.") | |
| st.text("3. To adjust the visualization, you can change the number of columns.") | |
| st.text("4. Finally, you can visualize your data.") | |
| st.error("This app includes lemmatization and stopwords. Currently, we only offer English words.", icon="💬") | |
| with tab3: | |
| st.text(""" | |
| +----------------+------------------------+----------------------------------+ | |
| | Source | File Type | Column | | |
| +----------------+------------------------+----------------------------------+ | |
| | Scopus | Comma-separated values | Choose your preferred column | | |
| | | (.csv) | that you have to analyze and | | |
| +----------------+------------------------| and need a column called "Year" | | |
| | Web of Science | Tab delimited file | | | |
| | | (.txt) | | | |
| +----------------+------------------------| | | |
| | Lens.org | Comma-separated values | | | |
| | | (.csv) | | | |
| +----------------+------------------------| | | |
| | Other | .csv | | | |
| +----------------+------------------------+----------------------------------+ | |
| """) | |
| with tab4: | |
| st.subheader(':blue[Burst Detection]', anchor=False) | |
| st.text("Click the camera icon on the top right menu") | |
| st.markdown("") | |
| st.divider() | |
| st.subheader(':blue[Top words]', anchor=False) | |
| st.button('Press to download list of top keywords 👈') | |
| st.text("Go to 📈 Generate visualization and click Download button.") | |
| st.divider() | |
| st.subheader(':blue[Burst]', anchor=False) | |
| st.button('Press to download the list of detected bursts 👈') | |
| st.text("Go to 📈 Generate visualization and click Download button.") | |
| elif option == 'Scattertext': | |
| tab1, tab2, tab3, tab4 = st.tabs(["Prologue", "Steps", "Requirements", "Download Visualization"]) | |
| with tab1: | |
| st.write("Scattertext is an open-source tool designed to visualize linguistic variations between document categories in a language-independent way. It presents a scatterplot, with each axis representing the rank-frequency of a term's occurrence within a category of documents.") | |
| st.divider() | |
| st.write('💡 The idea came from this:') | |
| st.write('Kessler, J. S. (2017). Scattertext: a Browser-Based Tool for Visualizing how Corpora Differ. https://doi.org/10.48550/arXiv.1703.00565') | |
| with tab2: | |
| st.text("1. Put your file. Choose your preferred column to analyze.") | |
| st.text("2. Choose your preferred method to compare and decide words you want to remove.") | |
| st.text("3. Finally, you can visualize your data.") | |
| st.error("This app includes lemmatization and stopwords. Currently, we only offer English words.", icon="💬") | |
| with tab3: | |
| st.text(""" | |
| +----------------+------------------------+----------------------------------+ | |
| | Source | File Type | Column | | |
| +----------------+------------------------+----------------------------------+ | |
| | Scopus | Comma-separated values | Choose your preferred column | | |
| | | (.csv) | that you have | | |
| +----------------+------------------------| | | |
| | Web of Science | Tab delimited file | | | |
| | | (.txt) | | | |
| +----------------+------------------------| | | |
| | Lens.org | Comma-separated values | | | |
| | | (.csv) | | | |
| +----------------+------------------------| | | |
| | Other | .csv | | | |
| +----------------+------------------------+----------------------------------+ | |
| """) | |
| with tab4: | |
| st.subheader(':blue[Scattertext]', anchor=False) | |
| st.write("Click the :blue[Download SVG] on the right side.") |