Spaces:
Running
Running
metadata
title: KPI Dashboard
emoji: 📊
colorFrom: blue
colorTo: blue
sdk: docker
pinned: false
license: apache-2.0
short_description: Example of a Key Performance Indicator (KPI) dashboard
KPI Dashboard
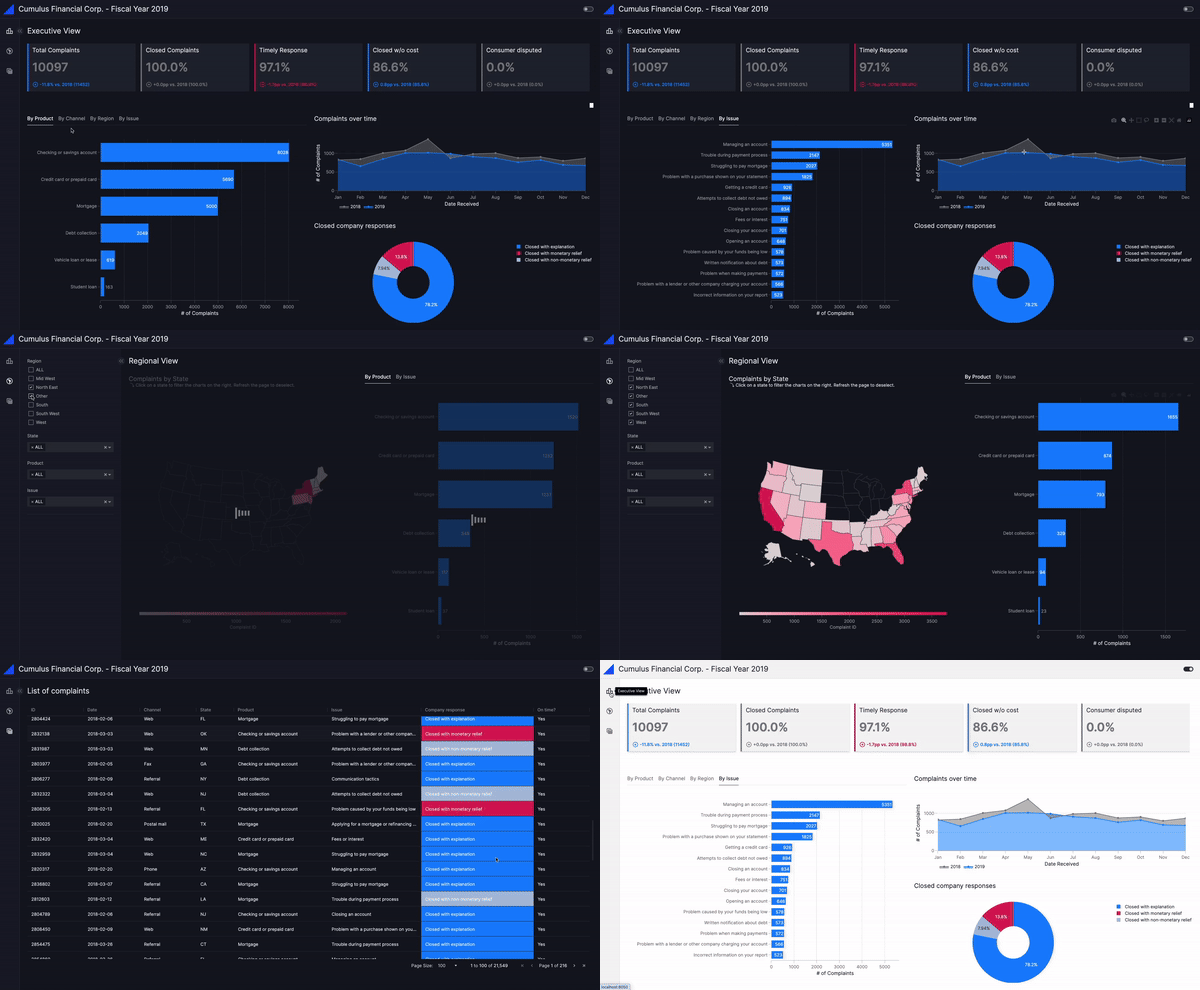
This dashboard provides an example of a Key Performance Indicator (KPI) dashboard, designed to help users get started and extend further. It uses fictional budget data to demonstrate the capabilities of Vizro using real world applications.
Created by: Huong Li Nguyen
🗓️ Data
Special thanks to the #RWFD Real World Fake Data initiative, a community project that provides high-quality fake data for creating realistic dashboard examples for real-world applications.
Note: The data has been additionally edited for the purpose of this example.
📊 Plotly resources
🚀 Vizro features applied
🖥️ App demo

How to run the example locally
- Run the
app.pyfile with your environment activated wherevizrois installed. - You should now be able to access the app locally via http://127.0.0.1:8050/.