Datasets:

The full dataset viewer is not available (click to read why). Only showing a preview of the rows.
Error code:   DatasetGenerationCastError
Exception:    DatasetGenerationCastError
Message:      An error occurred while generating the dataset

All the data files must have the same columns, but at some point there are 1 new columns ({'hint'})

This happened while the json dataset builder was generating data using

hf://datasets/DEVAI-benchmark/DEVAI/instances/03_Text_Classification_NaiveBayes_20Newsgroups_ML.json (at revision b0e3f09b3ff39e93eb624dda1fce8bf855c24e89)

Please either edit the data files to have matching columns, or separate them into different configurations (see docs at https://hf.co/docs/hub/datasets-manual-configuration#multiple-configurations)
Traceback:    Traceback (most recent call last):
                File "/src/services/worker/.venv/lib/python3.9/site-packages/datasets/builder.py", line 1869, in _prepare_split_single
                  writer.write_table(table)
                File "/src/services/worker/.venv/lib/python3.9/site-packages/datasets/arrow_writer.py", line 580, in write_table
                  pa_table = table_cast(pa_table, self._schema)
                File "/src/services/worker/.venv/lib/python3.9/site-packages/datasets/table.py", line 2292, in table_cast
                  return cast_table_to_schema(table, schema)
                File "/src/services/worker/.venv/lib/python3.9/site-packages/datasets/table.py", line 2240, in cast_table_to_schema
                  raise CastError(
              datasets.table.CastError: Couldn't cast
              name: string
              query: string
              tags: list<item: string>
                child 0, item: string
              requirements: list<item: struct<requirement_id: int64, prerequisites: list<item: int64>, criteria: string, category: string, satisfied: null>>
                child 0, item: struct<requirement_id: int64, prerequisites: list<item: int64>, criteria: string, category: string, satisfied: null>
                    child 0, requirement_id: int64
                    child 1, prerequisites: list<item: int64>
                        child 0, item: int64
                    child 2, criteria: string
                    child 3, category: string
                    child 4, satisfied: null
              preferences: list<item: struct<preference_id: int64, criteria: string, satisfied: null>>
                child 0, item: struct<preference_id: int64, criteria: string, satisfied: null>
                    child 0, preference_id: int64
                    child 1, criteria: string
                    child 2, satisfied: null
              is_kaggle_api_needed: bool
              is_training_needed: bool
              is_web_navigation_needed: bool
              hint: string
              to
              {'name': Value(dtype='string', id=None), 'query': Value(dtype='string', id=None), 'tags': Sequence(feature=Value(dtype='string', id=None), length=-1, id=None), 'requirements': [{'requirement_id': Value(dtype='int64', id=None), 'prerequisites': Sequence(feature=Value(dtype='int64', id=None), length=-1, id=None), 'criteria': Value(dtype='string', id=None), 'category': Value(dtype='string', id=None), 'satisfied': Value(dtype='null', id=None)}], 'preferences': [{'preference_id': Value(dtype='int64', id=None), 'criteria': Value(dtype='string', id=None), 'satisfied': Value(dtype='null', id=None)}], 'is_kaggle_api_needed': Value(dtype='bool', id=None), 'is_training_needed': Value(dtype='bool', id=None), 'is_web_navigation_needed': Value(dtype='bool', id=None)}
              because column names don't match

              During handling of the above exception, another exception occurred:

              Traceback (most recent call last):
                File "/src/services/worker/src/worker/job_runners/config/parquet_and_info.py", line 1392, in compute_config_parquet_and_info_response
                  parquet_operations = convert_to_parquet(builder)
                File "/src/services/worker/src/worker/job_runners/config/parquet_and_info.py", line 1041, in convert_to_parquet
                  builder.download_and_prepare(
                File "/src/services/worker/.venv/lib/python3.9/site-packages/datasets/builder.py", line 924, in download_and_prepare
                  self._download_and_prepare(
                File "/src/services/worker/.venv/lib/python3.9/site-packages/datasets/builder.py", line 999, in _download_and_prepare
                  self._prepare_split(split_generator, **prepare_split_kwargs)
                File "/src/services/worker/.venv/lib/python3.9/site-packages/datasets/builder.py", line 1740, in _prepare_split
                  for job_id, done, content in self._prepare_split_single(
                File "/src/services/worker/.venv/lib/python3.9/site-packages/datasets/builder.py", line 1871, in _prepare_split_single
                  raise DatasetGenerationCastError.from_cast_error(
              datasets.exceptions.DatasetGenerationCastError: An error occurred while generating the dataset

              All the data files must have the same columns, but at some point there are 1 new columns ({'hint'})

              This happened while the json dataset builder was generating data using

              hf://datasets/DEVAI-benchmark/DEVAI/instances/03_Text_Classification_NaiveBayes_20Newsgroups_ML.json (at revision b0e3f09b3ff39e93eb624dda1fce8bf855c24e89)

              Please either edit the data files to have matching columns, or separate them into different configurations (see docs at https://hf.co/docs/hub/datasets-manual-configuration#multiple-configurations)
Need help to make the dataset viewer work? Make sure to review how to configure the dataset viewer, and open a discussion for direct support.
name
string | query
string | tags
sequence | requirements
list | preferences
list | is_kaggle_api_needed
bool | is_training_needed
bool | is_web_navigation_needed
bool | hint
string |
|---|---|---|---|---|---|---|---|---|
01_Image_Classification_ResNet18_Fashion_MNIST_DL | Hey! Could you help me set up a system to classify images from the Fashion-MNIST dataset using the ResNet-18 model in PyTorch? The Fashion-MNIST dataset should be loaded in `src/data_loader.py`. I'd like the system to show the training progress with the tqdm library in the training loop in `src/train.py` and to perform some data augmentation with `torchvision.transforms` (like rotation and scaling) to make the model more robust. The latter should be implemented in `src/data_loader.py` and the ResNet-18 model should be imported from PyTorch in `src/model.py`. Once the training is done, please save the trained model as `fashionnet.pt` in the `models/saved_models/` directory. It would be great if the training process could be as efficient as possible. Also, please try to write the code in an easily understandable and easily maintainable style. If you can, it would be awesome to include some insights into model interpretability too, such as by using Grad-CAM or something similar. Thanks a lot! | [
"Classification",
"Computer Vision",
"Supervised Learning"
] | [
{
"requirement_id": 0,
"prerequisites": [],
"criteria": "The \"Fashion-MNIST\" dataset is loaded in `src/data_loader.py`.",
"category": "Dataset or Environment",
"satisfied": null
},
{
"requirement_id": 1,
"prerequisites": [
0
],
"criteria": "Data augmentation is performed using `torchvision.transforms`, including rotation, scaling, etc. The implementation is in `src/data_loader.py`.",
"category": "Data preprocessing and postprocessing",
"satisfied": null
},
{
"requirement_id": 2,
"prerequisites": [],
"criteria": "The \"ResNet-18\" model is imported from \"PyTorch\" in `src/model.py`.",
"category": "Machine Learning Method",
"satisfied": null
},
{
"requirement_id": 3,
"prerequisites": [
0,
1,
2
],
"criteria": "Training progress is displayed using the \"tqdm\" library in the main training loop in `src/train.py`.",
"category": "Visualization",
"satisfied": null
},
{
"requirement_id": 4,
"prerequisites": [
0,
1,
2,
3
],
"criteria": "The trained model is saved under the file name `fashionnet.pt` in `models/saved_models/`.",
"category": "Save Trained Model",
"satisfied": null
}
] | [
{
"preference_id": 0,
"criteria": "Code should be written in a clear, understandable and maintainable style with appropriate comments.",
"satisfied": null
},
{
"preference_id": 1,
"criteria": "The training process should be efficient.",
"satisfied": null
},
{
"preference_id": 2,
"criteria": "Insights of model interpretability should be provided, such as using techniques like Grad-CAM for visualization.",
"satisfied": null
}
] | false | true | false | null |
02_Maze_Solver_Q_Learning_Gridworld_RL | Can you help me create a system to solve maze-style Gridworld tasks using the Q-learning algorithm? The system should use numpy to make the core calculations more efficient and matplotlib for visualizations. The Q-learning algorithm should be implemented in `src/train.py`, and the aptly-named Gridworld environment should be implemented in `src/env.py` in such a way that one could specific the grid size and start/end positions when instantiating it. The system needs to record the learning curve during training, tracking episodes and their corresponding returns, and save it as `results/figures/learning_curve.png`. Additionally, I'd like you to visualize and save the paths taken by the agent in each episode in a file called `results/figures/path_changes.gif`, and save the trained model as `models/saved_models/q_learning_model.npy`. It would be great to have some form of real-time feedback during training, like seeing the progress or getting updates on how the model is learning. Also, if you can, please try and write the code in a way that's easy to modify or extend later on. | [
"Reinforcement Learning"
] | [
{
"requirement_id": 0,
"prerequisites": [],
"criteria": "The \"Q-learning\" algorithm is used in `src/train.py`.",
"category": "Machine Learning Method",
"satisfied": null
},
{
"requirement_id": 1,
"prerequisites": [],
"criteria": "The \"Gridworld\" environment is defined in `src/env.py` with the ability for a user to specify a grid size and start/end positions.",
"category": "Dataset or Environment",
"satisfied": null
},
{
"requirement_id": 2,
"prerequisites": [
0,
1
],
"criteria": "Learning curves are recorded during training, and saved as `results/figures/learning_curve.png`. Episodes and returns are recorded.",
"category": "Visualization",
"satisfied": null
},
{
"requirement_id": 3,
"prerequisites": [
0,
1,
2
],
"criteria": "The learned model is saved as `models/saved_models/q_learning_model.npy`.",
"category": "Save Trained Model",
"satisfied": null
},
{
"requirement_id": 4,
"prerequisites": [
0,
1
],
"criteria": "Paths taken during learning are visualized and saved as `results/figures/path_changes.gif`.",
"category": "Visualization",
"satisfied": null
}
] | [
{
"preference_id": 0,
"criteria": "Some real-time progress or feedback during the training process should be displayed.",
"satisfied": null
},
{
"preference_id": 1,
"criteria": "The code should be written in a way that's easy to modify or extend later on.",
"satisfied": null
}
] | false | true | false | null |
03_Text_Classification_NaiveBayes_20Newsgroups_ML | Please implement a Naive Bayes classifier for the 20 Newsgroups dataset and save it in a file called `src/model.py`. The dataset should loaded in `src/data_loader.py`. The program should handle data preprocessing, including removing stop words, punctuation, and special characters. Show the improvement of your classifier by generating word clouds before and after training your classifier and saving them as `results/figures/wordcloud_before.png` and `results/figures/wordcloud_after.png`. Please calculate and include TF-IDF features when loading the data in `src/data_loader.py`. Lastly, print out a performance report (including precision, recall, and F1-score) and save it as `results/metrics/performance.txt`. The model should be straightforward to interpret, and the final report should be structured clearly for easy review. | [
"Classification",
"Natural Language Processing",
"Supervised Learning"
] | [
{
"requirement_id": 0,
"prerequisites": [],
"criteria": "The \"20 Newsgroups\" dataset is used in `src/data_loader.py`.",
"category": "Dataset or Environment",
"satisfied": null
},
{
"requirement_id": 1,
"prerequisites": [
0
],
"criteria": "Data preprocessing is performed, including removing stop words, punctuation, and special characters. Word clouds are visualized before and after training the classifier, and saved as `results/figures/wordcloud_before.png` and `results/figures/wordcloud_after.png`.",
"category": "Data preprocessing and postprocessing",
"satisfied": null
},
{
"requirement_id": 2,
"prerequisites": [
0,
1
],
"criteria": "\"TF-IDF\" features are used when loading the data in `src/data_loader.py`.",
"category": "Data preprocessing and postprocessing",
"satisfied": null
},
{
"requirement_id": 3,
"prerequisites": [],
"criteria": "A \"Naive Bayes classifier\" is implemented in `src/model.py`.",
"category": "Machine Learning Method",
"satisfied": null
},
{
"requirement_id": 4,
"prerequisites": [
0,
1,
2
],
"criteria": "A performance report, including \"precision,\" \"recall,\" and the \"F1-score,\" is printed and saved as `results/metrics/performance.txt`.",
"category": "Performance Metrics",
"satisfied": null
}
] | [
{
"preference_id": 0,
"criteria": "The model should be straightforward to interpret.",
"satisfied": null
},
{
"preference_id": 1,
"criteria": "The final report should be structured clearly for easy review.",
"satisfied": null
}
] | false | true | false | In the query, there is a missing word "be" after the word "should" in "The dataset should loaded in `src/data_loader.py`". |
04_Text_Generation_GPT2_Prompts_DL | Please build a text generation system by automatically downloading a pre-trained GPT-2 model which you then cache in `models/saved_models/`. The system should receive prompts through loading the current contents of a text file named `data/prompt.txt` which, for demonstration purposes, should contain only the text "who are you?" in your implementation. You should automatically correct any typos you run into while reading `data/prompt.txt`. Ensure the generated text is limited to a maximum of 200 characters and your program should save the generated text to `results/generated_text.txt`. Implement post-processing to clean up the generated text by removing extra spaces and correcting common spelling errors. It would be ideal if the system could handle different variations of input prompts efficiently, even with minor typos. Additionally, a user-friendly output format in the saved file (perhaps with timestamps or prompt identifiers) would be nice to have. | [
"Generative Models",
"Natural Language Processing"
] | [
{
"requirement_id": 0,
"prerequisites": [],
"criteria": "A pre-trained \"GPT-2\" model is downloaded and cached in `models/saved_models/`.",
"category": "Machine Learning Method",
"satisfied": null
},
{
"requirement_id": 1,
"prerequisites": [],
"criteria": "Prompts are read from a text file named `data/prompt.txt` and fed into the model.",
"category": "Human Computer Interaction",
"satisfied": null
},
{
"requirement_id": 2,
"prerequisites": [
0,
1
],
"criteria": "Generation length is limited to a maximum of 200 characters.",
"category": "Other",
"satisfied": null
},
{
"requirement_id": 3,
"prerequisites": [
0,
1,
2
],
"criteria": "Post-processing is implemented to clean up the text, including removing extra spaces and correcting common spelling errors.",
"category": "Data preprocessing and postprocessing",
"satisfied": null
},
{
"requirement_id": 4,
"prerequisites": [
0,
1,
2,
3
],
"criteria": "The generated text is saved in `results/generated_text.txt`.",
"category": "Other",
"satisfied": null
}
] | [
{
"preference_id": 0,
"criteria": "The system should handle different input prompts efficiently and correct for minor typos.",
"satisfied": null
},
{
"preference_id": 1,
"criteria": "The system should operate efficiently, with minimal latency during text generation.",
"satisfied": null
},
{
"preference_id": 2,
"criteria": "A user-friendly output format in the saved file, perhaps with timestamps or prompt identifiers, should be used.",
"satisfied": null
}
] | false | false | false | There is only one prompt to read. However, requirment 1 says "Prompts". |
05_Game_Simulation_DQN_CartPole_v1_RL | Create a reliable system to train a DQN agent using PyTorch in an OpenAI Gym environment such as CartPole-v1. Implement DQN using PyTorch in `src/model.py`. The environment should be instantiated in the main file, `src/main.py`. Handle any dimension mismatches between DQN and the environment (like would happen if the Gym environment ID were changed) by logging an error. Also please log the return after each episode to `results/metrics/` and update it after each new episode finishes. Save the final return over episode curve as `results/figures/return_over_time.png` and the final trained model as `models/saved_models/dqn_model.pt`. If possible, add annotations to the return over episode curve to showcase key milestones. | [
"Reinforcement Learning"
] | [
{
"requirement_id": 0,
"prerequisites": [],
"criteria": "The \"DQN\" algorithm is implemented using PyTorch and saved in `src/model.py`.",
"category": "Machine Learning Method",
"satisfied": null
},
{
"requirement_id": 1,
"prerequisites": [],
"criteria": "An \"OpenAI Gym\" environment is instantiated in `src/main.py`.",
"category": "Dataset or Environment",
"satisfied": null
},
{
"requirement_id": 2,
"prerequisites": [
0,
1
],
"criteria": "The return over time curve is plotted, recording the return of each episode, and saved as `results/figures/reward_over_time.png`.",
"category": "Visualization",
"satisfied": null
},
{
"requirement_id": 3,
"prerequisites": [
0,
1
],
"criteria": "The trained model is saved as `models/saved_models/dqn_model.pt`.",
"category": "Save Trained Model",
"satisfied": null
},
{
"requirement_id": 4,
"prerequisites": [
0,
1
],
"criteria": "The return for each episode is logged to `results/metrics/` and updated after each episode finishes.",
"category": "Performance Metrics",
"satisfied": null
}
] | [
{
"preference_id": 0,
"criteria": "The system should handle dimension mismatches, logging the issues for easy debugging.",
"satisfied": null
},
{
"preference_id": 1,
"criteria": "The return over episode curve has key milestones annotated.",
"satisfied": null
}
] | false | true | false | null |
06_Sentiment_Analysis_SVM_Sentiment140_ML | Please help me build a system for sentiment analysis on tweets using the Sentiment140 dataset available from Hugging Face. Load the Sentiment140 dataset and, when loading the data, clean it by removing stop words, punctuation, and special characters, all in `src/data_loader.py`. Use Word2Vec or GloVe for text vectorization. This should occur in `src/data_loader.py`. Next, implement and train an SVM classifier in `src/model.py`. Finally, write a report of the accuracy of the classifier to `results/metrics/accuracy_score.txt`. Ideally, the report should be easily interpretable. | [
"Natural Language Processing",
"Supervised Learning"
] | [
{
"requirement_id": 0,
"prerequisites": [],
"criteria": "The \"Sentiment140\" dataset, available from \"Hugging Face,\" is obtained in `src/data_loader.py`.",
"category": "Dataset or Environment",
"satisfied": null
},
{
"requirement_id": 1,
"prerequisites": [
0
],
"criteria": "The dataset is cleaned, including by removing stop words, punctuation, and special characters, all in `src/data_loader.py`.",
"category": "Data preprocessing and postprocessing",
"satisfied": null
},
{
"requirement_id": 2,
"prerequisites": [
0,
1
],
"criteria": "Word embeddings, either \"Word2Vec\" or \"GloVe,\" are used to convert text to vectors in `src/data_loader.py`.",
"category": "Machine Learning Method",
"satisfied": null
},
{
"requirement_id": 3,
"prerequisites": [
0,
1,
2
],
"criteria": "An \"SVM classifier\" is implemented and trained in `src/model.py`.",
"category": "Machine Learning Method",
"satisfied": null
},
{
"requirement_id": 4,
"prerequisites": [
1,
2,
3
],
"criteria": "The accuracy score is printed and saved as `results/metrics/accuracy_score.txt`.",
"category": "Performance Metrics",
"satisfied": null
}
] | [
{
"preference_id": 0,
"criteria": "The dataset download process should be reliable, with clear error handling.",
"satisfied": null
},
{
"preference_id": 1,
"criteria": "The final accuracy report should be straightforward and easy to interpret.",
"satisfied": null
}
] | false | true | false | null |
07_Image_Super_Resolution_SRCNN_Set5_DL | Hi, I need to create a project for image super-resolution using the SRCNN model with the Set5 dataset (available from `https://huggingface.co/datasets/eugenesiow/Set5`). Load the dataset in `src/data_loader.py`. When loading the data, include image preprocessing steps such as resizing and normalization, all in `src/data_loader.py`. The SRCNN model should be loaded and used in `src/model.py`. Save 5 sets of comparison images, zooming in on details, as `results/figures/super_resolution_compare.png`, and the super-resolution results as `results/figures/super_resolution_results.png`. The generated images should be high-quality and clearly show improvements. | [
"Computer Vision",
"Generative Models"
] | [
{
"requirement_id": 0,
"prerequisites": [],
"criteria": "The \"Set5\" dataset (available from \"Hugging Face\") is loaded in `src/data_loader.py`.",
"category": "Dataset or Environment",
"satisfied": null
},
{
"requirement_id": 1,
"prerequisites": [
0
],
"criteria": "Image preprocessing, including resizing and normalization, is performed in `src/data_loader.py`.",
"category": "Data preprocessing and postprocessing",
"satisfied": null
},
{
"requirement_id": 2,
"prerequisites": [],
"criteria": "The \"SRCNN\" model is used in `src/model.py`.",
"category": "Machine Learning Method",
"satisfied": null
},
{
"requirement_id": 3,
"prerequisites": [
0,
1,
2
],
"criteria": "Five sets of comparison images are saved, with details zoomed in, and saved as `results/figures/super_resolution_compare.png`.",
"category": "Visualization",
"satisfied": null
},
{
"requirement_id": 4,
"prerequisites": [
0,
1,
2
],
"criteria": "Super-resolution results are saved as `results/figures/super_resolution_results.png`.",
"category": "Visualization",
"satisfied": null
}
] | [
{
"preference_id": 0,
"criteria": "The project should generate high-quality, clear super-resolution images with detailed comparisons.",
"satisfied": null
},
{
"preference_id": 1,
"criteria": "Well-organized output images, highlighting key improvements, should be included.",
"satisfied": null
}
] | false | true | true | null |
08_Robot_Control_PPO_PyBullet_RL | I am seeking to implement a project which explores robotic arm control via reinforcement learning in the PyBullet simulation environment with the PPO algorithm. The PyBullet simulator should be imported and a related robotics environment should be loaded in `src/env.py`. The PPO algorithm should be implemented in `src/train.py`. The project should meticulously document the robot's final position, printing and saving it as `data/final_position.txt`. The training return trajectory should be graphed and saved as `results/figures/training_returns.png`. A sample of the robot's motion should be visualized and saved as `results/figures/robot_motion.gif`. A detailed environment setup and reward structure description should be provided in `src/env.py`. Please ensure that any issues with loading URDF files in PyBullet are clearly handled and documented, providing clear error messages or logging for debugging. | [
"Reinforcement Learning"
] | [
{
"requirement_id": 0,
"prerequisites": [],
"criteria": "The \"PyBullet\" simulator is used in `src/env.py`.",
"category": "Dataset or Environment",
"satisfied": null
},
{
"requirement_id": 1,
"prerequisites": [],
"criteria": "The \"PPO\" algorithm is used in `src/train.py`.",
"category": "Machine Learning Method",
"satisfied": null
},
{
"requirement_id": 2,
"prerequisites": [
0
],
"criteria": "A detailed environment setup and reward structure description is provided in `src/env.py`.",
"category": "Dataset or Environment",
"satisfied": null
},
{
"requirement_id": 3,
"prerequisites": [
0,
1,
2
],
"criteria": "The robot's final position is printed and saved as `data/final_position.txt`.",
"category": "Other",
"satisfied": null
},
{
"requirement_id": 4,
"prerequisites": [
0,
1,
2
],
"criteria": "The training returns over time curve is recorded and saved as `results/figures/training_returns.png`.",
"category": "Visualization",
"satisfied": null
},
{
"requirement_id": 5,
"prerequisites": [
0,
1,
2
],
"criteria": "A sample of the robot's motion is visualized and saved as `results/figures/robot_motion.gif`.",
"category": "Visualization",
"satisfied": null
}
] | [
{
"preference_id": 0,
"criteria": "The system should effectively handle potential issues with loading URDF files in PyBullet, providing clear error messages or logging for debugging.",
"satisfied": null
}
] | false | true | false | null |
09_Recommendation_System_NCF_MovieLens_ML | Help me develop a system to recommend movies based on user ratings from the MovieLens dataset using a Neural Collaborative Filtering (NCF) approach. First, load the dataset and split it into training and testing sets in `src/data_loader.py`. Next, implement the NCF approach and a matrix factorization baseline in `src/model.py`. Using these, print an example of the top 10 recommendations for a test user the NCF approach and the baseline and save them to `results/metrics/top_10_recommendations.txt`. It would be good if these sample recommendations were meaningful given the test user. Evaluate the system's performance using RMSE, MAE, etc., and save the results of this evaluation to `results/metrics/evaluation_metrics.txt`. Try and ensure that there is robust path handling that can deal with missing directories and such when saving files. | [
"Recommender Systems",
"Supervised Learning"
] | [
{
"requirement_id": 0,
"prerequisites": [],
"criteria": "The \"Neural Collaborative Filtering (NCF)\" algorithm is implemented in `src/model.py`.",
"category": "Machine Learning Method",
"satisfied": null
},
{
"requirement_id": 1,
"prerequisites": [],
"criteria": "The \"MovieLens\" dataset is loaded in 'src/data_loader.py'.",
"category": "Dataset or Environment",
"satisfied": null
},
{
"requirement_id": 2,
"prerequisites": [
1
],
"criteria": "Data is split into training and testing sets in `src/data_loader.py`.",
"category": "Data preprocessing and postprocessing",
"satisfied": null
},
{
"requirement_id": 3,
"prerequisites": [],
"criteria": "A matrix factorization baseline is implemented in in `src/model.py`.",
"category": "Machine Learning Method",
"satisfied": null
},
{
"requirement_id": 4,
"prerequisites": [
0,
1,
2,
3
],
"criteria": "The top 10 recommendations for a test user under the \"NCF\" approach and the baseline are saved in `results/metrics/top_10_recommendations.txt`.",
"category": "Other",
"satisfied": null
},
{
"requirement_id": 5,
"prerequisites": [
0,
1,
2,
3
],
"criteria": "The recommendation system performance is evaluated, including with \"RMSE\" and \"MAE,\" and the results are saved as `results/metrics/evaluation_metrics.txt`.",
"category": "Performance Metrics",
"satisfied": null
}
] | [
{
"preference_id": 0,
"criteria": "Robust path handling is implemented to deal with things like missing directories.",
"satisfied": null
},
{
"preference_id": 1,
"criteria": "The top 10 recommendations should be clear and relevant to the sample user's preferences.",
"satisfied": null
}
] | false | true | false | null |
10_Face_Recognition_FaceNet_LFW_DL | Help me create a PyTorch face recognition project using the FaceNet model with the LFW dataset. Load the dataset in `src/model.py`. Get the model from Hugging Face (you can find it at https://huggingface.co/py-feat/facenet) and save it in `models/saved_models/`. Ensure the data is preprocessed to ensure the standardization of facial images in `src/data_loader.py`. Use facial embeddings in `src/model.py` to improve the performance of your system. Print the recognition accuracy and save it to `results/metrics/recognition_accuracy.txt`. Next, visualize the embedding results and save them as `results/figures/embedding_visualization.png`. The model should load without issues, ideally with some error handling if something goes wrong. The visualizations should make it easy to see how the embeddings represent distinct facial features. | [
"Computer Vision",
"Supervised Learning"
] | [
{
"requirement_id": 0,
"prerequisites": [],
"criteria": "The \"LFW\" (Labeled Faces in the Wild) dataset is loaded in `src/data_loader.py`.",
"category": "Dataset or Environment",
"satisfied": null
},
{
"requirement_id": 1,
"prerequisites": [
0
],
"criteria": "Data alignment and standardization of facial images is performed in `src/data_loader.py`.",
"category": "Data preprocessing and postprocessing",
"satisfied": null
},
{
"requirement_id": 2,
"prerequisites": [],
"criteria": "The \"FaceNet\" model in \"PyTorch\" is used, loading from [Hugging Face](https://huggingface.co/py-feat/facenet). Save the model in models/saved_models/.",
"category": "Machine Learning Method",
"satisfied": null
},
{
"requirement_id": 3,
"prerequisites": [
0,
1,
2
],
"criteria": "Facial embeddings are used in `src/model.py`.",
"category": "Machine Learning Method",
"satisfied": null
},
{
"requirement_id": 4,
"prerequisites": [
0,
1,
2,
3
],
"criteria": "Recognition accuracy is printed and saved as `results/metrics/recognition_accuracy.txt`.",
"category": "Performance Metrics",
"satisfied": null
},
{
"requirement_id": 5,
"prerequisites": [
0,
1,
2,
3
],
"criteria": "Embedding results are visualized and saved as `results/figures/embedding_visualization.png`.",
"category": "Visualization",
"satisfied": null
}
] | [
{
"preference_id": 0,
"criteria": "The model loading process should be smooth, with clear handling of any issues if the model fails to load.",
"satisfied": null
},
{
"preference_id": 1,
"criteria": "Embedding visualizations should be clear and effectively highlight distinct facial features.",
"satisfied": null
}
] | false | false | true | The page https://huggingface.co/py-feat/facenet provides guidance on how to use FaceNet; however, Hugging Face does not currently offer a model entry for direct use. |
11_House_Price_Prediction_LinearRegression_BostonHousing_ML | Hi. Set up a house price prediction project using a Linear Regression model on the Boston Housing dataset. Load the dataset using `from datasets import load_dataset` and `ds = load_dataset("~/mrseba/boston_house_price")` in `src/data_loader.py`. Ensure feature scaling and data standardization are performed in `src/data_loader.py`. Implement the Linear Regression model in `src/model.py`. Use cross-validation to evaluate the model in `src/train.py`. Print the Mean Squared Error (MSE), Mean Absolute Error (MAE), and $R^2$ score, and save them under `results/metrics/metrics.txt`. Visualize the comparison between predicted and actual values and save the result as `results/figures/`prediction_vs_actual.png`. The visualizations should clearly demonstrate the model's accuracy (which, if done right, should be good). | [
"Financial Analysis",
"Regression",
"Supervised Learning"
] | [
{
"requirement_id": 0,
"prerequisites": [],
"criteria": "The \"Boston Housing\" dataset is utilized using `from datasets import load_dataset` and `ds = load_dataset(\"mrseba/boston_house_price\")` in `src/data_loader.py`.",
"category": "Dataset or Environment",
"satisfied": null
},
{
"requirement_id": 1,
"prerequisites": [
0
],
"criteria": "Feature scaling and data standardization are performed in `src/data_loader.py`.",
"category": "Data preprocessing and postprocessing",
"satisfied": null
},
{
"requirement_id": 2,
"prerequisites": [],
"criteria": "The \"Linear Regression\" model is implemented in `src/model.py`.",
"category": "Machine Learning Method",
"satisfied": null
},
{
"requirement_id": 3,
"prerequisites": [
0,
1,
2
],
"criteria": "\"Cross-validation\" is used to evaluate the model in `src/train.py`.",
"category": "Performance Metrics",
"satisfied": null
},
{
"requirement_id": 4,
"prerequisites": [
0,
1,
2,
3
],
"criteria": "\"Mean Squared Error (MSE),\" \"Mean Absolute Error (MAE),\" and \"R^2 score\" are printed, and saved as `results/metrics/metrics.txt`.",
"category": "Performance Metrics",
"satisfied": null
},
{
"requirement_id": 5,
"prerequisites": [
0,
1,
2,
3
],
"criteria": "The comparison of predicted vs. actual values is visualized and saved as `results/figures/prediction_vs_actual.png`.",
"category": "Visualization",
"satisfied": null
}
] | [
{
"preference_id": 0,
"criteria": "The dataset should load smoothly using the provided `load_dataset` code, and other methods should be tried if issues arise.",
"satisfied": null
},
{
"preference_id": 1,
"criteria": "The visualizations should clearly demonstrate the model's accuracy by highlighting the differences between predicted and actual values.",
"satisfied": null
}
] | false | true | false | `ds = load_dataset("~/mrseba/boston_house_price")` in the query is wrong, and it should be `ds = load_dataset("mrseba/boston_house_price")`. We leave it here to check the self-debugging skill of the agents. |
12_Spam_Detection_SVM_Enron_ML | Hello. I need you to build a project to detect spam emails using the Support Vector Machine (SVM) classifier on the Enron-Spam dataset. The project should preprocess the text by removing stop words and punctuation, employ TF-IDF features, perform hyperparameter tuning using GridSearchCV, and save the confusion matrix to `results/figures/confusion_matrix.png`. I also need to write and save a comprehensive report, including precision, recall, F1-score, and the confusion matrix (to be generated as `results/figures/confusion_matrix.png`), under `results/classification_report.pdf`. The Enron-Spam dataset should be loaded in `src/data_loader.py`. Text preprocessing, including removing stop words and punctuation, and calculating TF-IDF features should be performed in `src/data_loader.py`. The SVM classifier should be implemented in `src/model.py`. Hyperparameter tuning should be performed using GridSearchCV in `src/train.py`. It would be helpful if the text preprocessing step is optimized to handle a large number of emails efficiently. | [
"Classification",
"Natural Language Processing",
"Supervised Learning"
] | [
{
"requirement_id": 0,
"prerequisites": [],
"criteria": "The \"Enron-Spam\" dataset is loaded in `src/data_loader.py`.",
"category": "Dataset or Environment",
"satisfied": null
},
{
"requirement_id": 1,
"prerequisites": [
0
],
"criteria": "Text preprocessing is performed, including removing stop words and punctuation in `src/data_loader.py`.",
"category": "Data preprocessing and postprocessing",
"satisfied": null
},
{
"requirement_id": 2,
"prerequisites": [
0,
1
],
"criteria": "\"TF-IDF\" features are used in `src/data_loader.py`.",
"category": "Data preprocessing and postprocessing",
"satisfied": null
},
{
"requirement_id": 3,
"prerequisites": [],
"criteria": "The \"SVM classifier\" is implemented in `src/model.py`.",
"category": "Machine Learning Method",
"satisfied": null
},
{
"requirement_id": 4,
"prerequisites": [
0,
1,
2,
3
],
"criteria": "Hyperparameter tuning is performed using \"GridSearchCV\" in `src/train.py`.",
"category": "Machine Learning Method",
"satisfied": null
},
{
"requirement_id": 5,
"prerequisites": [
0,
1,
2,
3,
4
],
"criteria": "The confusion matrix is saved as `results/figures/confusion_matrix.png`.",
"category": "Visualization",
"satisfied": null
},
{
"requirement_id": 6,
"prerequisites": [
0,
1,
2,
3,
4,
5
],
"criteria": "A classification report, including \"precision,\" \"recall,\" \"F1-score,\" and the figure `results/figures/confusion_matrix.png`, is saved as `results/classification_report.pdf`.",
"category": "Performance Metrics",
"satisfied": null
}
] | [
{
"preference_id": 0,
"criteria": "The text preprocessing step should be optimized to handle a large number of emails efficiently.",
"satisfied": null
},
{
"preference_id": 1,
"criteria": "The classification report should be comprehensive.",
"satisfied": null
}
] | false | true | false | null |
13_Style_Transfer_Perceptual_Loss_CustomImages_DL | Please create a PyTorch Perceptual Loss project for image style transfer (refer to this paper: https://arxiv.org/pdf/1603.08155). You can build the Perceptual Loss Network using VGG16 in `src/model.py`. The project should combine content and style images, allow smooth adjustment of style intensity by tuning the weights of style loss and content loss, and save the stylized images in `results/figures/`. Additionally, log the processing time to `results/processing_time.txt`, and save the intermediate results of the style transfer process to `results/figures/intermediate_results.png`. For testing, input a famous content image (Mona Lisa) from [this link](https://upload.wikimedia.org/wikipedia/commons/thumb/e/ec/Mona_Lisa%2C_by_Leonardo_da_Vinci%2C_from_C2RMF_retouched.jpg/768px-Mona_Lisa%2C_by_Leonardo_da_Vinci%2C_from_C2RMF_retouched.jpg) and a famous style image (The Starry Night) from [this link](https://ia904705.us.archive.org/34/items/the-starry-night-vincent-van-gogh/The%20Starry%20Night%20-%20Vincent%20van%20Gogh/%21PREVIEW%21%20-%20The%20Starry%20Night%20-%20Vincent%20van%20Gogh.jpg), and generate a style-transfered image. Save the content, style, and style-transfered images to `data/content.jpg`, `data/style.jpg`, and `results/figures/`, respectively. The project should efficiently handle high-resolution images without excessive processing time. | [
"Computer Vision",
"Generative Models"
] | [
{
"requirement_id": 0,
"prerequisites": [],
"criteria": "A famous content image is inputted for testing, downloaded from [this link](https://upload.wikimedia.org/wikipedia/commons/thumb/e/ec/Mona_Lisa%2C_by_Leonardo_da_Vinci%2C_from_C2RMF_retouched.jpg/768px-Mona_Lisa%2C_by_Leonardo_da_Vinci%2C_from_C2RMF_retouched.jpg) and saved to `data/content.jpg`.",
"category": "Dataset or Environment",
"satisfied": null
},
{
"requirement_id": 1,
"prerequisites": [],
"criteria": "A famous style image is inputted for testing, downloaded from [this link](https://ia904705.us.archive.org/34/items/the-starry-night-vincent-van-gogh/The%20Starry%20Night%20-%20Vincent%20van%20Gogh/%21PREVIEW%21%20-%20The%20Starry%20Night%20-%20Vincent%20van%20Gogh.jpg) and saved in `data/style.jpg`.",
"category": "Dataset or Environment",
"satisfied": null
},
{
"requirement_id": 2,
"prerequisites": [],
"criteria": "The Perceptual loss model implemented in \"PyTorch\" is loaded in `src/model.py`.",
"category": "Machine Learning Method",
"satisfied": null
},
{
"requirement_id": 3,
"prerequisites": [
0,
1,
2
],
"criteria": "Stylized images are saved to the specified folder `results/figures/`.",
"category": "Other",
"satisfied": null
},
{
"requirement_id": 4,
"prerequisites": [
0,
1,
2
],
"criteria": "Style intensity is adjusted by tuning the weights of style loss and content loss in `src/model.py`.",
"category": "Machine Learning Method",
"satisfied": null
},
{
"requirement_id": 5,
"prerequisites": [
0,
1,
2,
3,
4
],
"criteria": "Processing time is recorded and saved as `results/processing_time.txt`.",
"category": "Performance Metrics",
"satisfied": null
},
{
"requirement_id": 6,
"prerequisites": [
0,
1,
2,
3,
4
],
"criteria": "Intermediate results of style transfer are saved as `results/figures/intermediate_results.png`.",
"category": "Visualization",
"satisfied": null
}
] | [
{
"preference_id": 0,
"criteria": "The style transfer process should allow for smooth adjustment of style intensity, making the stylized image visually appealing.",
"satisfied": null
},
{
"preference_id": 1,
"criteria": "The project should handle high-resolution images efficiently without excessive processing time.",
"satisfied": null
}
] | false | false | false | VGG16 was not originally designed for style transfer. However, the user's query states, 'Please create a PyTorch project for image style transfer using a pre-trained VGG16 model.' Ideally, a well-informed agent should create or find a model for style transfer networks that incorporate pre-trained VGG16, rather than simply loading the VGG16 model. |
14_Customer_Churn_Prediction_LogisticRegression_Telco_ML | Help me develop a system to predict customer churn using the Telco Customer Churn dataset, potentially being downloaded from [this link](https://huggingface.co/datasets/scikit-learn/churn-prediction). Load the dataset in `src/data_loader.py`. The project should include feature engineering, such as feature selection and scaling, and handle imbalanced data using oversampling or undersampling techniques implemented in `src/data_loader.py`. The exact details of this are left for you to decide. Implement a Logistic Regression model in `src/model.py` and perform cross-validation while training the model in `src/train.py`. Finally, print and save the classification report (including precision, recall, and F1-score) to `results/metrics/classification_report.txt`, and save a ROC curve to `results/figures/roc_curve.png`. Ensure the dataset loads smoothly with appropriate error handling. The feature engineering should thoroughly select the most relevant features. | [
"Classification",
"Supervised Learning"
] | [
{
"requirement_id": 0,
"prerequisites": [],
"criteria": "The \"Telco Customer Churn\" dataset is used, potentially being downloaded from [this link](https://huggingface.co/datasets/scikit-learn/churn-prediction). Load the dataset in `src/data_loader.py`.",
"category": "Dataset or Environment",
"satisfied": null
},
{
"requirement_id": 1,
"prerequisites": [
0
],
"criteria": "Feature engineering, including feature selection and scaling, is implemented in `src/data_loader.py`.",
"category": "Data preprocessing and postprocessing",
"satisfied": null
},
{
"requirement_id": 2,
"prerequisites": [
0
],
"criteria": "Imbalanced data is handled using oversampling or undersampling techniques in `src/data_loader.py`.",
"category": "Data preprocessing and postprocessing",
"satisfied": null
},
{
"requirement_id": 3,
"prerequisites": [],
"criteria": "The \"Logistic Regression\" model is implemented in `src/model.py`.",
"category": "Machine Learning Method",
"satisfied": null
},
{
"requirement_id": 4,
"prerequisites": [
1,
2,
3
],
"criteria": "Cross-validation is used to evaluate the model in `src/train.py`.",
"category": "Performance Metrics",
"satisfied": null
},
{
"requirement_id": 5,
"prerequisites": [
0,
1,
2,
3,
4
],
"criteria": "A classification report, including \"precision,\" \"recall,\" and \"F1-score,\" is saved as `results/metrics/classification_report.txt`.",
"category": "Performance Metrics",
"satisfied": null
},
{
"requirement_id": 6,
"prerequisites": [
0,
1,
2,
3,
4
],
"criteria": "A \"ROC curve\" is saved as `results/figures/roc_curve.png`.",
"category": "Visualization",
"satisfied": null
}
] | [
{
"preference_id": 0,
"criteria": "The dataset should load smoothly, with proper error handling if issues arise during download.",
"satisfied": null
},
{
"preference_id": 1,
"criteria": "The feature engineering process should be thorough, ensuring that the most relevant features are selected for the model.",
"satisfied": null
}
] | false | true | true | null |
15_Image_Captioning_ShowAndTell_Flickr8k_DL | This is my current PyTorch project: Develop an automatic image captioning system using the Show and Tell model. Here I found a repo can guide you: https://github.com/sgrvinod/a-PyTorch-Tutorial-to-Image-Captioning. Use the dataset Flickr8k dataset, downloading it from [this link](https://huggingface.co/datasets/jxie/flickr8k) and load it in `src/data_loader.py`. The system should generate descriptions of sample images and save them to `results/metrics/generated_descriptions.txt`. An attention mechanism must be implemented in `src/model.py`. Save the pre-trained model as `models/saved_models/show_and_tell_model.pt`. Visualize the attention weights and save it to `results/figures/attention_weights.png`. The dataset should load smoothly, with proper error handling if any issues arise. Ideally, the attention mechanism should clearly highlight the image regions that are most influential in generating captions. | [
"Computer Vision",
"Natural Language Processing"
] | [
{
"requirement_id": 0,
"prerequisites": [],
"criteria": "The pre-trained \"Show and Tell\" model is used.",
"category": "Machine Learning Method",
"satisfied": null
},
{
"requirement_id": 1,
"prerequisites": [],
"criteria": "The \"Flickr8k\" dataset, potentially downloaded from [this link](https://huggingface.co/datasets/jxie/flickr8k), is loaded in `src/data_loader.py`.",
"category": "Dataset or Environment",
"satisfied": null
},
{
"requirement_id": 2,
"prerequisites": [
0,
1
],
"criteria": "The attention mechanism is implemented in `src/model.py`.",
"category": "Machine Learning Method",
"satisfied": null
},
{
"requirement_id": 3,
"prerequisites": [
0,
1,
2
],
"criteria": "Generated descriptions of sample images are saved in `results/metrics/generated_descriptions.txt`.",
"category": "Other",
"satisfied": null
},
{
"requirement_id": 4,
"prerequisites": [
0,
1,
2
],
"criteria": "The trained model is saved as `models/saved_models/show_and_tell_model.pt`.",
"category": "Save Trained Model",
"satisfied": null
},
{
"requirement_id": 5,
"prerequisites": [
0,
1,
2
],
"criteria": "A visualization of attention weights is saved as `results/figures/attention_weights.png`.",
"category": "Visualization",
"satisfied": null
}
] | [
{
"preference_id": 0,
"criteria": "The dataset should load smoothly, with clear error handling if any issues arise during download.",
"satisfied": null
},
{
"preference_id": 1,
"criteria": "The attention mechanism should clearly highlight the image regions that contribute most to the generated captions.",
"satisfied": null
}
] | false | true | true | null |
16_Credit_Scoring_DecisionTree_GermanCredit_ML | Help me develop a system to predict credit scores using the German Credit dataset, which can be downloaded from [this link](https://archive.ics.uci.edu/dataset/144/statlog+german+credit+data). Load the dataset and preprocess it, including handling missing values and feature encoding, in `src/data_loader.py`. Use a Decision Tree classifier implemented in `src/model.py` with cross-validation to evaluate the model in `src/train.py`. Visualize feature importances in `results/figures/feature_importances.png`. Generate a classification report, including precision, recall, and F1-score, and save it to `results/metrics/classification_report.txt`. Create a Markdown report with results and visualizations and save it in `results/report.md`. The dataset should load smoothly with proper error handling, and the Markdown report should be well-organized for easy review. | [
"Classification",
"Supervised Learning"
] | [
{
"requirement_id": 0,
"prerequisites": [],
"criteria": "Load the \"German Credit\" dataset, potentially downloading it from [this link](https://archive.ics.uci.edu/dataset/144/statlog+german+credit+data) in the `src/data_loader.py` file.",
"category": "Dataset or Environment",
"satisfied": null
},
{
"requirement_id": 1,
"prerequisites": [
0
],
"criteria": "Data preprocessing is performed in `src/data_loader.py`, including handling missing values and feature encoding.",
"category": "Data preprocessing and postprocessing",
"satisfied": null
},
{
"requirement_id": 2,
"prerequisites": [],
"criteria": "A \"Decision Tree\" classifier is implemented in `src/model.py`.",
"category": "Machine Learning Method",
"satisfied": null
},
{
"requirement_id": 3,
"prerequisites": [
1,
2
],
"criteria": "Cross-validation is used to evaluate the model in `src/train.py`.",
"category": "Performance Metrics",
"satisfied": null
},
{
"requirement_id": 4,
"prerequisites": [
0,
1,
2,
3
],
"criteria": "Feature importances are visualized in `results/figures/feature_importances.png`.",
"category": "Visualization",
"satisfied": null
},
{
"requirement_id": 5,
"prerequisites": [
0,
1,
2,
3
],
"criteria": "A classification report, including \"precision,\" \"recall,\" and \"F1-score,\" is generated and saved as `results/metrics/classification_report.txt`.",
"category": "Performance Metrics",
"satisfied": null
},
{
"requirement_id": 6,
"prerequisites": [
0,
1,
2,
3,
4,
5
],
"criteria": "A Markdown file containing results and visualizations is generated and saved in `results/report.md`.",
"category": "Visualization",
"satisfied": null
}
] | [
{
"preference_id": 0,
"criteria": "The dataset should load smoothly, with clear error handling if any issues arise during download.",
"satisfied": null
},
{
"preference_id": 1,
"criteria": "The Markdown report should be well-organized, making it easy to review all the results and visualizations.",
"satisfied": null
}
] | false | true | true | null |
17_Heart_Disease_Prediction_XGBoost_UCI_ML | Create a project to predict heart disease using an XGBoost model with the UCI Heart Disease dataset, which can be downloaded from [this link](https://archive.ics.uci.edu/dataset/45/heart+disease). Load the dataset in `src/data_loader.py`. Implement feature selection and data standardization in `src/data_loader.py`. Use SHAP values to explain the feature importance, and save the results as `results/figures/shap_importance.png`. Implement the XGBoost model in `src/model.py`. Then, use SHAP values to explain the feature importance, and save the results as `results/shap_importance.png`. Save the ROC curve to `results/figures/roc_curve.png`. Finally, generate an HTML report containing all the results and visualizations, and save it as `results/report.html`. Ensure the SHAP visualizations clearly highlight the most impactful features. Include a performance comparison with another model, such as Logistic Regression, to validate the robustness of the XGBoost model. Save the XGBoost model under `models/saved_models/`. | [
"Classification",
"Medical Analysis",
"Supervised Learning"
] | [
{
"requirement_id": 0,
"prerequisites": [],
"criteria": "The \"UCI Heart Disease\" dataset is used, potentially being downloaded from [this link](https://archive.ics.uci.edu/dataset/45/heart+disease). Load the dataset in `src/data_loader.py`.",
"category": "Dataset or Environment",
"satisfied": null
},
{
"requirement_id": 1,
"prerequisites": [
0
],
"criteria": "Feature selection is implemented in `src/data_loader.py`.",
"category": "Data preprocessing and postprocessing",
"satisfied": null
},
{
"requirement_id": 2,
"prerequisites": [
0
],
"criteria": "Data standardization which ensures feature values are within the same range is implemented in `src/data_loader.py`.",
"category": "Data preprocessing and postprocessing",
"satisfied": null
},
{
"requirement_id": 3,
"prerequisites": [],
"criteria": "The \"XGBoost\" model is implemented in `src/model.py`.",
"category": "Machine Learning Method",
"satisfied": null
},
{
"requirement_id": 4,
"prerequisites": [
0,
1,
2,
3
],
"criteria": "\"SHAP\" values are used for feature importance explanation, with results saved as `results/figures/shap_importance.png`.",
"category": "Visualization",
"satisfied": null
},
{
"requirement_id": 5,
"prerequisites": [
0,
1,
2,
3
],
"criteria": "The ROC curve saved as `results/figures/roc_curve.png`.",
"category": "Visualization",
"satisfied": null
},
{
"requirement_id": 6,
"prerequisites": [
0,
1,
2,
3,
4,
5
],
"criteria": "An HTML report containing results and visualizations is generated, saved as `results/report.html`.",
"category": "Visualization",
"satisfied": null
},
{
"requirement_id": 7,
"prerequisites": [
1,
2,
3
],
"criteria": "A performance comparison with another model (e.g., Logistic Regression) is included to validate the robustness of the XGBoost model.",
"category": "Other",
"satisfied": null
},
{
"requirement_id": 8,
"prerequisites": [
1,
2,
3
],
"criteria": "A XGBoost model is saved under `models/saved_models/`.",
"category": "Save Trained Model",
"satisfied": null
}
] | [
{
"preference_id": 0,
"criteria": "The SHAP visualizations should be clear and highlight the most impactful features, making the results easy to interpret.",
"satisfied": null
}
] | false | true | true | null |
18_Image_Enhancement_SRGAN_DIV2K_DL | I need to create a system for image enhancement using an SRGAN model (you can obtain a pre-trained SRGAN [here](https://github.com/tensorlayer/srgan)) with the DIV2K dataset, which can be downloaded from [this link](https://data.vision.ee.ethz.ch/cvl/DIV2K/). The dataset should be loaded in the `src/data_loader.py` file. The system should preprocess the images, including resizing and normalization, in `src/data_loader.py`. Use a pre-trained model saved under `models/saved_models/` to save time, and save the enhanced images to the `results/figures/` directory. Additionally, the system should visualize and save the comparison between the original and enhanced images to `results/figures/enhanced_comparison.png`. Finally, create a Markdown report with results and visualizations on a diverse set of samples to showcase the model's performance on various types of images, and save it as `results/report.md`. The report should include a detailed comparison of the model's performance on these selected samples, highlighting where the model excels or struggles. | [
"Computer Vision",
"Generative Models"
] | [
{
"requirement_id": 0,
"prerequisites": [],
"criteria": "The \"DIV2K\" dataset is loaded in the `src/data_loader.py` file.",
"category": "Dataset or Environment",
"satisfied": null
},
{
"requirement_id": 1,
"prerequisites": [],
"criteria": "A pre-trained \"SRGAN\" model is saved under `models/saved_models/`.",
"category": "Save Trained Model",
"satisfied": null
},
{
"requirement_id": 2,
"prerequisites": [
0
],
"criteria": "Image preprocessing, including resizing and normalization, is implemented in `src/data_loader.py`.",
"category": "Data preprocessing and postprocessing",
"satisfied": null
},
{
"requirement_id": 3,
"prerequisites": [
0,
1,
2
],
"criteria": "Enhanced images are saved to the specified folder `results/figures/`.",
"category": "Data preprocessing and postprocessing",
"satisfied": null
},
{
"requirement_id": 4,
"prerequisites": [
0,
1,
2,
3
],
"criteria": "The comparison of original and enhanced images is visualized and saved as `results/figures/enhanced_comparison.png`.",
"category": "Visualization",
"satisfied": null
},
{
"requirement_id": 5,
"prerequisites": [
1,
2,
3,
4
],
"criteria": "A Markdown file containing results and visualizations is generated and saved as `results/report.md`.",
"category": "Visualization",
"satisfied": null
}
] | [
{
"preference_id": 0,
"criteria": "A diverse set of samples should be selected to showcase the model's performance across different types of images.",
"satisfied": null
},
{
"preference_id": 1,
"criteria": "The Markdown report should include a detailed comparison of the model's performance on these selected samples, highlighting where the model excels or struggles.",
"satisfied": null
}
] | false | false | true | null |
19_Time_Series_Forecasting_Seq2Seq_LSTM_Rossmann_ML | Develop a sales forecasting system using a sequence-to-sequence model based on LSTM with the Rossmann Store Sales dataset, downloading it from Kaggle [here](https://www.kaggle.com/c/rossmann-store-sales/data) and loading it in `src/data_loader.py`. Split the data into training and testing sets and save them in `src/data_loader.py`. Apply a sequence-to-sequence model based on `LSTM` and save the trained model under the `models/saved_models/` directory. Save the forecast results as `results/figures/forecast_results.png`. Save a comparison plot between the predicted and actual values to `results/figures/comparison_plot.png`. Generate an HTML report that includes the prediction results and comparison plots, with some interactive elements for exploring different forecast horizons, and save it as `results/report.html`. Ensure the model is tuned to capture seasonal trends in the sales data. | [
"Supervised Learning",
"Time Series Forecasting"
] | [
{
"requirement_id": 0,
"prerequisites": [],
"criteria": "The \"Rossmann Store Sales\" dataset is used, potentially downloaded from Kaggle [this link](https://www.kaggle.com/c/rossmann-store-sales/data) and loaded in `src/data_loader.py`.",
"category": "Dataset or Environment",
"satisfied": null
},
{
"requirement_id": 1,
"prerequisites": [
0
],
"criteria": "The data is split into training and testing sets and implemented in `src/data_loader.py`.",
"category": "Data preprocessing and postprocessing",
"satisfied": null
},
{
"requirement_id": 2,
"prerequisites": [
1
],
"criteria": "A sequence-to-sequence model based on \"LSTM\" is used. Please save the trained model under the `models/saved_models/` directory.",
"category": "Machine Learning Method",
"satisfied": null
},
{
"requirement_id": 3,
"prerequisites": [
1,
2
],
"criteria": "The forecast results are plotted and saved as `results/figures/forecast_results.png`.",
"category": "Visualization",
"satisfied": null
},
{
"requirement_id": 4,
"prerequisites": [
1,
2,
3
],
"criteria": "A comparison plot of predicted vs. actual values is saved as `results/figures/comparison_plot.png`.",
"category": "Visualization",
"satisfied": null
},
{
"requirement_id": 5,
"prerequisites": [
1,
2,
3,
4
],
"criteria": "An HTML report containing forecast results and comparison plots is generated and saved as `results/report.html`.",
"category": "Visualization",
"satisfied": null
},
{
"requirement_id": 6,
"prerequisites": [
5
],
"criteria": "The HTML report should include interactive elements that allow users to explore different forecast horizons.",
"category": "Human Computer Interaction",
"satisfied": null
}
] | [
{
"preference_id": 0,
"criteria": "The model should be tuned to capture seasonal trends in the sales data for more accurate forecasting.",
"satisfied": null
}
] | true | true | true | null |
20_Car_Price_Prediction_RandomForest_CarPrices_ML | Can you help me create a car price prediction project using a Random Forest model with the Kaggle Car Prices dataset? Load the dataset and perform feature selection to identify important features in `src/data_loader.py`. Use cross-validation to evaluate the model in `src/train.py`. Save the R-squared score, Mean Squared Error (MSE), and Mean Absolute Error (MAE) to `results/metrics/results/metrics.txt`. Visualize the feature importance and save it to `results/figures/feature_importance.png`. Generate a Markdown report with insights into how the selected features contribute to the car price predictions. Saving the report as `results/report.md`. | [
"Financial Analysis",
"Regression",
"Supervised Learning"
] | [
{
"requirement_id": 0,
"prerequisites": [],
"criteria": "The \"Kaggle Car Prices\" dataset is loaded in `src/data_loader.py`.",
"category": "Dataset or Environment",
"satisfied": null
},
{
"requirement_id": 1,
"prerequisites": [
0
],
"criteria": "Feature selection is implemented to identify important features in `src/data_loader.py`.",
"category": "Data preprocessing and postprocessing",
"satisfied": null
},
{
"requirement_id": 2,
"prerequisites": [],
"criteria": "The \"Random Forest\" regression model is used in `src/model.py`.",
"category": "Machine Learning Method",
"satisfied": null
},
{
"requirement_id": 3,
"prerequisites": [
0,
1,
2
],
"criteria": "Cross-validation is used to evaluate the model in `src/train.py`.",
"category": "Performance Metrics",
"satisfied": null
},
{
"requirement_id": 4,
"prerequisites": [
1,
2,
3
],
"criteria": "The \"R-squared\" score, \"Mean Squared Error (MSE),\" and \"Mean Absolute Error (MAE)\" are saved in `results/metrics/results/metrics.txt`.",
"category": "Performance Metrics",
"satisfied": null
},
{
"requirement_id": 5,
"prerequisites": [
1,
2,
3
],
"criteria": "Feature importances are visualized and saved as `results/figures/feature_importance.png`.",
"category": "Visualization",
"satisfied": null
},
{
"requirement_id": 6,
"prerequisites": [
1,
2,
3,
4,
5
],
"criteria": "A Markdown file containing results and visualizations is generated and saved as `results/report.md`.",
"category": "Visualization",
"satisfied": null
}
] | [
{
"preference_id": 0,
"criteria": "The feature selection process should be thorough, ensuring that only the most relevant features are used in the model.",
"satisfied": null
},
{
"preference_id": 1,
"criteria": "The Markdown report should provide clear insights into how the selected features contribute to the car price predictions.",
"satisfied": null
}
] | true | true | false | null |
21_Iris_Classification_SVM_Iris_ML | I request a project to classify iris species utilizing the Iris dataset with a Support Vector Machine (SVM) classifier implemented in `src/model.py`. The project should standardize the data in and perform feature selection in `src/data_loader.py`. It will document the classification accuracy and save it as `results/metrics/classification_accuracy.txt`, and generate and save a confusion matrix as `results/figures/confusion_matrix.png`. It will further create an interactive web application in `src/app.py` using Streamlit to showcase classification results and model performance, with the figures stored in `results/figures/`. The web page should be user-friendly, with a brief explanation of the model to help users understand how the SVM classifier works. | [
"Classification",
"Supervised Learning"
] | [
{
"requirement_id": 0,
"prerequisites": [],
"criteria": "The \"Iris\" dataset is used.",
"category": "Dataset or Environment",
"satisfied": null
},
{
"requirement_id": 1,
"prerequisites": [
0
],
"criteria": "Data is standardized to ensure feature values are within the same range in `src/data_loader.py`.",
"category": "Data preprocessing and postprocessing",
"satisfied": null
},
{
"requirement_id": 2,
"prerequisites": [
0
],
"criteria": "Feature selection is performed to identify important features in `src/data_loader.py`.",
"category": "Data preprocessing and postprocessing",
"satisfied": null
},
{
"requirement_id": 3,
"prerequisites": [],
"criteria": "The \"SVM classifier\" is implemented in `src/model.py`.",
"category": "Machine Learning Method",
"satisfied": null
},
{
"requirement_id": 4,
"prerequisites": [
1,
2,
3
],
"criteria": "Classification accuracy is saved in `results/metrics/classification_accuracy.txt`.",
"category": "Performance Metrics",
"satisfied": null
},
{
"requirement_id": 5,
"prerequisites": [
1,
2,
3
],
"criteria": "A confusion matrix is generated and saved as `results/figures/confusion_matrix.png`.",
"category": "Visualization",
"satisfied": null
},
{
"requirement_id": 6,
"prerequisites": [
2,
3,
4,
5
],
"criteria": "An interactive web application `src/app.py` is created using \"Streamlit\"` to showcase classification results and model performance in results/figures/.",
"category": "Human Computer Interaction",
"satisfied": null
}
] | [
{
"preference_id": 0,
"criteria": "The Streamlit web page should be user-friendly, allowing users to easily explore different aspects of the model's performance.",
"satisfied": null
},
{
"preference_id": 1,
"criteria": "A brief model explanation should be included on the web page, helping users understand how the SVM classifier works.",
"satisfied": null
}
] | false | true | false | null |
22_Sentiment_Analysis_LSTM_IMDb_DL | Could you help me set up a sentiment analysis project using an LSTM model and the IMDb dataset? Please implement data cleaning in `src/data_loader.py`, including the removal of stop words and punctuation. Use word embeddings to convert the text to a numerical format and save these embeddings under `models/saved_models/`. Then use these embeddings as input of an LSTM model, which should be implemented in `src/model.py`. Save the classification report to `results/metrics/classification_report.txt`. Create a Jupyter Notebook saved as `results/report.ipynb` with the model architecture and training process visualized. Also, save the training loss and accuracy curves to `results/figures/training_curves.png`. Pre-trained embeddings (e.g., Word2Vec or GloVe) are preferred to enhance model performance. | [
"Natural Language Processing",
"Supervised Learning"
] | [
{
"requirement_id": 0,
"prerequisites": [],
"criteria": "The \"IMDb\" movie reviews dataset is used.",
"category": "Dataset or Environment",
"satisfied": null
},
{
"requirement_id": 1,
"prerequisites": [
0
],
"criteria": "Data cleaning is implemented in `src/data_loader.py`, including the removal of stop words and punctuation.",
"category": "Data preprocessing and postprocessing",
"satisfied": null
},
{
"requirement_id": 2,
"prerequisites": [
0,
1
],
"criteria": "Word embeddings are used to convert text to numerical format and saved under `models/saved_models/`.",
"category": "Data preprocessing and postprocessing",
"satisfied": null
},
{
"requirement_id": 3,
"prerequisites": [],
"criteria": "An \"LSTM\" model is used for sentiment analysis and should be implemented in `src/model.py`.",
"category": "Machine Learning Method",
"satisfied": null
},
{
"requirement_id": 4,
"prerequisites": [
2,
3
],
"criteria": "A classification report is saved as `results/metrics/classification_report.txt`.",
"category": "Performance Metrics",
"satisfied": null
},
{
"requirement_id": 5,
"prerequisites": [
2,
3
],
"criteria": "A Jupyter Notebook containing the model architecture and training process visualization is generated and saved as `results/report.ipynb`.",
"category": "Visualization",
"satisfied": null
},
{
"requirement_id": 6,
"prerequisites": [
2,
3
],
"criteria": "Training loss and accuracy curves are generated and saved as `results/figures/training_curves.png`.",
"category": "Visualization",
"satisfied": null
}
] | [
{
"preference_id": 0,
"criteria": "The word embeddings should be pre-trained (e.g., Word2Vec or GloVe) to leverage existing semantic knowledge.",
"satisfied": null
},
{
"preference_id": 1,
"criteria": "The Jupyter Notebook should be well-documented, making it easy for others to understand the model architecture and training process.",
"satisfied": null
}
] | false | true | false | null |
23_Wine_Quality_Prediction_DecisionTree_WineQuality_ML | Build a wine quality prediction system using a Decision Tree model with the Wine Quality dataset from UCI. Preprocess the data in `src/data_loader.py`, including handling missing values and feature scaling. Use cross-validation to evaluate the model in `src/train.py`. Implement the Decision Tree regression model in `src/model.py`.Save the mean squared error in `results/metrics/mean_squared_error.txt`. Visualize and save feature importance as `results/figures/feature_importance.png`. Create a Jupyter Notebook with results and visualizations, and summarize your observations. The Notebook should thoroughly document the preprocessing steps to ensure reproducibility. Convert the Notebook to a PDF report and save it as `results/report.pdf`. The PDF report should also include a brief discussion on potential improvements of the model. | [
"Classification",
"Supervised Learning"
] | [
{
"requirement_id": 0,
"prerequisites": [],
"criteria": "The \"Wine Quality\" dataset from \"UCI\" is used.",
"category": "Dataset or Environment",
"satisfied": null
},
{
"requirement_id": 1,
"prerequisites": [
0
],
"criteria": "Data preprocessing is performed in `src/data_loader.py`, including handling missing values and feature scaling.",
"category": "Data preprocessing and postprocessing",
"satisfied": null
},
{
"requirement_id": 2,
"prerequisites": [],
"criteria": "The \"Decision Tree\" regression model is implemented in `src/model.py`.",
"category": "Machine Learning Method",
"satisfied": null
},
{
"requirement_id": 3,
"prerequisites": [
0,
1,
2
],
"criteria": "Cross-validation is used to evaluate the model in `src/train.py`.",
"category": "Performance Metrics",
"satisfied": null
},
{
"requirement_id": 4,
"prerequisites": [
0,
1,
2,
3
],
"criteria": "The Mean Squared Error (MSE) is saved in `results/metrics/mean_squared_error.txt`.",
"category": "Performance Metrics",
"satisfied": null
},
{
"requirement_id": 5,
"prerequisites": [
0,
1,
2,
3
],
"criteria": "The feature importance plot is generated and saved as `results/figures/feature_importance.png`.",
"category": "Visualization",
"satisfied": null
},
{
"requirement_id": 6,
"prerequisites": [
0,
1,
2,
3,
4,
5
],
"criteria": "A Jupyter Notebook containing preprocessing steps, results and visualizations is generated with observations summarized. The Notebook is converted to a PDF report and saved as `results/report.pdf`.",
"category": "Visualization",
"satisfied": null
}
] | [
{
"preference_id": 0,
"criteria": "The feature importance plot should clearly highlight the top influential features.",
"satisfied": null
},
{
"preference_id": 1,
"criteria": "The final PDF report should include a brief discussion on potential improvements of the model.",
"satisfied": null
}
] | false | true | false | null |
24_Diabetes_Prediction_LogisticRegression_PimaIndians_ML | Set up a diabetes prediction project using a Logistic Regression model and the Pima Indians Diabetes dataset. Perform feature scaling and data standardization in `src/data_loader.py`. Use cross-validation to evaluate the model in `src/train.py`, and save the accuracy score to `results/metrics/accuracy_score.txt`. Generate and save the ROC curve to `results/figures/roc_curve.png`. Create an interactive dashboard using Tableau or Power BI to showcase the model's performance and highlight important features. Ensure the dashboard is user-friendly and document the dataset processing and visualization creation steps. During development, the system should automatically manage the opening and closing of Tableau or Power BI to prevent unnecessary blocking. | [
"Classification",
"Medical Analysis",
"Supervised Learning"
] | [
{
"requirement_id": 0,
"prerequisites": [],
"criteria": "The \"Pima Indians Diabetes\" dataset is used.",
"category": "Dataset or Environment",
"satisfied": null
},
{
"requirement_id": 1,
"prerequisites": [
0
],
"criteria": "Feature scaling and data standardization are implemented in `src/data_loader.py`.",
"category": "Data preprocessing and postprocessing",
"satisfied": null
},
{
"requirement_id": 2,
"prerequisites": [
1
],
"criteria": "A \"Logistic Regression\" model is implemented in `src/model.py`.",
"category": "Machine Learning Method",
"satisfied": null
},
{
"requirement_id": 3,
"prerequisites": [
0,
1,
2
],
"criteria": "Cross-validation is used to evaluate the model in `src/train.py`.",
"category": "Performance Metrics",
"satisfied": null
},
{
"requirement_id": 4,
"prerequisites": [
1,
2,
3
],
"criteria": "The accuracy score is saved in `results/metrics/accuracy_score.txt`.",
"category": "Performance Metrics",
"satisfied": null
},
{
"requirement_id": 5,
"prerequisites": [
1,
2,
3
],
"criteria": "The ROC curve is generated and saved as `results/figures/roc_curve.png`.",
"category": "Visualization",
"satisfied": null
},
{
"requirement_id": 6,
"prerequisites": [
1,
2,
3,
4,
5
],
"criteria": "An interactive visualization dashboard using \"Tableau\" or \"Power BI\" is created to showcase model performance and important features. ",
"category": "Visualization",
"satisfied": null
}
] | [
{
"preference_id": 0,
"criteria": "The dashboard should allow users to explore different aspects of the model's performance and understand which features contribute most to predictions.",
"satisfied": null
},
{
"preference_id": 1,
"criteria": "The dashboard should clearly show how the dataset was processed and how the visualizations were created.",
"satisfied": null
},
{
"preference_id": 2,
"criteria": "During development, the system should automatically open and close \"Tableau\" or \"Power BI\" as needed to avoid long periods of blocking or inactivity.",
"satisfied": null
}
] | false | true | false | null |
25_Speech_Emotion_Recognition_CNN_LSTM_RAVDESS_DL | I am seeking a speech emotion recognition project using a CNN-LSTM model with the RAVDESS dataset, which should be downloaded from Kaggle or [this Hugging Face link](https://huggingface.co/datasets/xbgoose/ravdess). The project should load the dataset and perform robust audio preprocessing (noise removal and normalization) and MFCC feature extraction, implemented in `src/data_loader.py`. The CNN-LSTM model should be implemented in `src/model.py`. Recognition accuracy should be saved in `results/metrics/recognition_accuracy.txt`, and a confusion matrix should be generated and saved as `results/figures/confusion_matrix.png`. Additionally, a user-friendly local API should be created using Flask to allow users to upload audio files and receive emotion recognition results, with the implementation included in `src/hci.py`. | [
"Audio Processing",
"Classification"
] | [
{
"requirement_id": 0,
"prerequisites": [],
"criteria": "The \"RAVDESS\" dataset is loaded in `src/data_loader.py`, which is downloaded from Kaggle or [this Hugging Face link](https://huggingface.co/datasets/xbgoose/ravdess).",
"category": "Dataset or Environment",
"satisfied": null
},
{
"requirement_id": 1,
"prerequisites": [
0
],
"criteria": "Audio preprocessing, including noise removal and normalization, is implemented in `src/data_loader.py`.",
"category": "Data preprocessing and postprocessing",
"satisfied": null
},
{
"requirement_id": 2,
"prerequisites": [
0,
1
],
"criteria": "MFCC feature extraction is implemented in `src/data_loader.py`.",
"category": "Data preprocessing and postprocessing",
"satisfied": null
},
{
"requirement_id": 3,
"prerequisites": [],
"criteria": "The \"CNN-LSTM\" model is implemented in `src/model.py`.",
"category": "Machine Learning Method",
"satisfied": null
},
{
"requirement_id": 4,
"prerequisites": [
2,
3
],
"criteria": "Recognition accuracy is saved in `results/metrics/recognition_accuracy.txt`.",
"category": "Performance Metrics",
"satisfied": null
},
{
"requirement_id": 5,
"prerequisites": [
2,
3,
4
],
"criteria": "The confusion matrix is generated and saved as `results/figures/confusion_matrix.png`.",
"category": "Visualization",
"satisfied": null
},
{
"requirement_id": 6,
"prerequisites": [
2,
3
],
"criteria": "A local API is created using \"Flask\" to allow users to upload audio files and receive emotion recognition results. The implementation should be included in `src/hci.py`.",
"category": "Human Computer Interaction",
"satisfied": null
}
] | [
{
"preference_id": 0,
"criteria": "The audio preprocessing step should be robust, effectively reducing noise while preserving the integrity of the speech signals.",
"satisfied": null
},
{
"preference_id": 1,
"criteria": "The local API should be user-friendly, with clear instructions for uploading files and interpreting results.",
"satisfied": null
}
] | true | true | true | null |
26_Mushroom_Classification_RandomForest_Mushroom_ML | Develop a mushroom classification system using a Random Forest model on the UCI Mushroom dataset. Load the dataset in the `src/data_loader.py` file. Ensure that feature engineering, including feature encoding and feature selection, and missing data handling are completed in `src/data_loader.py` before training the model. Train the Random Forest classifier on the processed dataset in `src/train.py`. Save the classification results `results/classification_results.txt`. Visualize and save the feature importance as `results/figures/feature_importance.png`, ensuring the visualization clearly highlights the most influential features. Create an interactive web page in `src/app.py` using Streamlit to showcase the classification results and model performance. The Streamlit web page should provide an overview of the model's performance and allow users to interact with the classification results. The system should manages the start and end of the Streamlit visualization properly. | [
"Classification",
"Supervised Learning"
] | [
{
"requirement_id": 0,
"prerequisites": [],
"criteria": "The \"UCI Mushroom\" dataset is loaded in the `src/data_loader.py` file.",
"category": "Dataset or Environment",
"satisfied": null
},
{
"requirement_id": 1,
"prerequisites": [
0
],
"criteria": "Feature engineering is performed, including feature encoding and feature selection in `src/data_loader.py`.",
"category": "Data preprocessing and postprocessing",
"satisfied": null
},
{
"requirement_id": 2,
"prerequisites": [
0,
1
],
"criteria": "Missing data is handled to ensure the dataset is clean before training in `src/data_loader.py`.",
"category": "Data preprocessing and postprocessing",
"satisfied": null
},
{
"requirement_id": 3,
"prerequisites": [],
"criteria": "A Random Forest classifier is trained on the processed dataset in `src/train.py`.",
"category": "Machine Learning Method",
"satisfied": null
},
{
"requirement_id": 4,
"prerequisites": [
2,
3
],
"criteria": "The classification results are saved in `results/classification_results.txt`.",
"category": "Performance Metrics",
"satisfied": null
},
{
"requirement_id": 5,
"prerequisites": [
2,
3
],
"criteria": "Feature importance is visualized and saved as `results/figures/feature_importance.png`.",
"category": "Visualization",
"satisfied": null
},
{
"requirement_id": 6,
"prerequisites": [
2,
3,
4
],
"criteria": "An interactive web page is created in `src/app.py` using \"Streamlit\" to showcase classification results and model performance.",
"category": "Human Computer Interaction",
"satisfied": null
}
] | [
{
"preference_id": 0,
"criteria": "The feature importance visualization should clearly highlight the most influential features, making it easy to interpret.",
"satisfied": null
},
{
"preference_id": 1,
"criteria": "The Streamlit web page should provide an overview of the model's performance and allow users to interact with the classification results.",
"satisfied": null
},
{
"preference_id": 2,
"criteria": "The system properly manages the start and end of the Streamlit visualization .",
"satisfied": null
}
] | false | true | false | null |
27_Image_Generation_DCGAN_MNIST_DL | I need to create a system for image generation using a DCGAN model with the MNIST`dataset. Load the MNIST dataset in `src/data_loader.py` and implement the DCGAN model in `src/model.py`. The system should ensure the use of the correct DCGAN architecture, save the generated images to `results/figures/`, monitor the model training by recording training loss under `results/metrics/` and generated images under `results/figures/`, and perform a hyperparameter search on the generation parameters such as noise vector dimensions and learning rate in `src/train.py` to improve performance. Additionally, create and save a GIF animation of the generated images to `results/figures/generated_images.gif`, present the training process and results in a well-structured Jupyter Notebook, and convert the Notebook into a polished PDF report saved as `results/training_report.pdf`. The DCGAN model architecture should be clearly documented in the Notebook to avoid confusion with other GAN variants. | [
"Computer Vision",
"Generative Models"
] | [
{
"requirement_id": 0,
"prerequisites": [],
"criteria": "The \"MNIST\" dataset is loaded in `src/data_loader.py`.",
"category": "Dataset or Environment",
"satisfied": null
},
{
"requirement_id": 1,
"prerequisites": [],
"criteria": "The \"DCGAN\" model, not a standard GAN, is implemented in `src/model.py`.",
"category": "Machine Learning Method",
"satisfied": null
},
{
"requirement_id": 2,
"prerequisites": [
0,
1
],
"criteria": "Generated images are saved to the specified folder `results/figures/`.",
"category": "Save Trained Model",
"satisfied": null
},
{
"requirement_id": 3,
"prerequisites": [
0,
1
],
"criteria": "The model training is monitored by recording training loss saved under `results/metrics/`",
"category": "Performance Metrics",
"satisfied": null
},
{
"requirement_id": 4,
"prerequisites": [
0,
1
],
"criteria": "A hyperparemeter search method to search parameters such as noise vector dimensions and learning rate is implemented in `src/train.py` to improve model performance.",
"category": "Machine Learning Method",
"satisfied": null
},
{
"requirement_id": 5,
"prerequisites": [
1,
2,
3,
4
],
"criteria": "A GIF animation of generated images is created and saved as `results/figures/generated_images.gif`.",
"category": "Visualization",
"satisfied": null
},
{
"requirement_id": 6,
"prerequisites": [
1,
2,
3,
4
],
"criteria": "The training process and results are presented in a Jupyter Notebook, and converted to a PDF report, and saved as `results/training_report.pdf`.",
"category": "Visualization",
"satisfied": null
}
] | [
{
"preference_id": 0,
"criteria": "The DCGAN model architecture should be clearly documented in the Notebook to avoid confusion with other GAN variants.",
"satisfied": null
},
{
"preference_id": 1,
"criteria": "The PDF report should be well-structured, with clear sections for model architecture, training process, results, and future improvements.",
"satisfied": null
}
] | false | true | false | Saving figures is mentioned twice, i.e., once in requirement 2 and once in requirement 3. |
28_Stock_Price_Prediction_LSTM_YahooFinance_ML | Could you help me build a stock price prediction system using an LSTM model and the Yahoo Finance dataset? Please clean the data, including handling missing values and outliers, and use a time window to convert the time series data to a supervised learning problem. The LSTM model should be implemented in `src/model.py`, and the dataset loading, cleaning, and conversion should be implemented in `src/data_loader.py`. Save the prediction results to `results/predictions.txt` and generate and save interactive charts of the prediction results in `results/figures/prediction_interactive.html` using Plotly. Create a Jupyter Notebook with model architecture visualization, training process, and prediction results and save it as a PDF report at `results/report.pdf`. | [
"Financial Analysis",
"Supervised Learning",
"Time Series Forecasting"
] | [
{
"requirement_id": 0,
"prerequisites": [],
"criteria": "The \"LSTM\" model is implemented in `src/model.py`.",
"category": "Machine Learning Method",
"satisfied": null
},
{
"requirement_id": 1,
"prerequisites": [],
"criteria": "The \"Yahoo Finance\" dataset is loaded in `src/data_loader.py`.",
"category": "Dataset or Environment",
"satisfied": null
},
{
"requirement_id": 2,
"prerequisites": [
1
],
"criteria": "Data cleaning, including handling missing values and outliers, is performed in `src/data_loader.py`.",
"category": "Data preprocessing and postprocessing",
"satisfied": null
},
{
"requirement_id": 3,
"prerequisites": [
0,
2
],
"criteria": "A time window is used to convert the time series data to a supervised learning problem. Please save the implementation in `src/data_loader.py`.",
"category": "Data preprocessing and postprocessing",
"satisfied": null
},
{
"requirement_id": 4,
"prerequisites": [
2,
3
],
"criteria": "Prediction results are saved in `results/predictions.txt`.",
"category": "Other",
"satisfied": null
},
{
"requirement_id": 5,
"prerequisites": [
0,
1,
2
],
"criteria": "Interactive charts of prediction results are generated using \"Plotly\" and saved in `results/figures/prediction_interactive.html`.",
"category": "Visualization",
"satisfied": null
},
{
"requirement_id": 6,
"prerequisites": [
0,
1,
2,
3,
4
],
"criteria": "A Jupyter Notebook containing the model architecture visualization, training process, and prediction results are created and saved as PDF report as `results/report.pdf`.",
"category": "Other",
"satisfied": null
}
] | [] | false | true | false | null |
29_Financial_Time_Series_Prediction_LSTM_ML | Could you help me set up a financial time series prediction system using an LSTM model with some real-world Financial Analysis, like stock prices or Bitcoin prices? First, we'll need to clean the data, taking care of any missing values and outliers in `src/data_loader.py`. Then, let's convert the time series data into a supervised learning format using a time window in `src/data_loader.py`. Finally apply a LSTM model for prediction, where the LSTM model is implemented in `src/model.py`. Once you've got the predictions, save the results as `results/prediction_results.text`. Create an interactive dashboard visualizing prediction results using Dash and save the implementation in `src/dashboard.py`. Finally, I'd appreciate a Markdown document that shows the model architecture, training process, and performance analysis, saved as `results/report.md`. Make sure the system manages the start and stop of the Dash app automatically to save resources. Thanks so much! | [
"Financial Analysis",
"Supervised Learning",
"Time Series Forecasting"
] | [
{
"requirement_id": 0,
"prerequisites": [],
"criteria": "Some real-world financial time series data (e.g., \"stock prices\" or \"Bitcoin prices\") is loaded in `src/data_loader.py`.",
"category": "Dataset or Environment",
"satisfied": null
},
{
"requirement_id": 1,
"prerequisites": [
0
],
"criteria": "Data cleaning is performed, including handling missing values and outliers in `src/data_loader.py`.",
"category": "Data preprocessing and postprocessing",
"satisfied": null
},
{
"requirement_id": 2,
"prerequisites": [
1
],
"criteria": "A time window is used to convert the time series data into a supervised learning problem. Please implement this in `src/data_loader.py`.",
"category": "Data preprocessing and postprocessing",
"satisfied": null
},
{
"requirement_id": 3,
"prerequisites": [],
"criteria": "An \"LSTM\" model is used for financial time series prediction and implemented in `src/model.py`.",
"category": "Machine Learning Method",
"satisfied": null
},
{
"requirement_id": 4,
"prerequisites": [
2,
3
],
"criteria": "Prediction results saved as `results/prediction_results.txt`.",
"category": "Other",
"satisfied": null
},
{
"requirement_id": 5,
"prerequisites": [
2,
3
],
"criteria": "An interactive visualization dashboard of prediction results is created using \"Dash\". The implementation is saved in `src/visualize.py`.",
"category": "Visualization",
"satisfied": null
},
{
"requirement_id": 6,
"prerequisites": [
2,
3,
4,
5
],
"criteria": "A Markdown document containing the model architecture, training process, and performance analysis is generated, and saved as `results/report.md`.",
"category": "Other",
"satisfied": null
}
] | [
{
"preference_id": 0,
"criteria": "The \"Dash\" dashboard should allow users to interact with the prediction results, enabling exploration of different time frames and zooming into specific periods for detailed analysis.",
"satisfied": null
},
{
"preference_id": 1,
"criteria": "During development, the system should automatically manage the start and stop of the \"Dash\" application to prevent unnecessary resource usage.",
"satisfied": null
}
] | false | true | false | null |
30_Image_Segmentation_UNet_PascalVOC_DL | Could you help me set up an image segmentation project using the Pascal VOC dataset and a pre-trained U-Net model implemented in PyTorch? There is no need for additional training. Apply data augmentation (e.g., flipping and rotating images), use the Dice coefficient for evaluation, save the segmented images to `results/figures/`, generate and save a GIF animation showing images before and after the segmentation to `results/figures/segmentation_results.gif`, and create a well-documented Jupyter Notebook with the model architecture, process, and segmentation results, converting it to an HTML report (saving it as `results/report.html`). | [
"Computer Vision"
] | [
{
"requirement_id": 0,
"prerequisites": [],
"criteria": "The \"Pascal VOC\" dataset is used in `src/data_loader.py`.",
"category": "Dataset or Environment",
"satisfied": null
},
{
"requirement_id": 1,
"prerequisites": [
0
],
"criteria": "Data augmentation, including flipping and rotating images, is performed in `src/data_loader.py`.",
"category": "Data preprocessing and postprocessing",
"satisfied": null
},
{
"requirement_id": 2,
"prerequisites": [],
"criteria": "A pre-trained \"U-Net\" model from PyTorch is used without additional training and saved in `models/saved_models/`.",
"category": "Machine Learning Method",
"satisfied": null
},
{
"requirement_id": 3,
"prerequisites": [
1,
2
],
"criteria": "The \"Dice coefficient\" is used for evaluation and should be saved in `results/metrics/`.",
"category": "Performance Metrics",
"satisfied": null
},
{
"requirement_id": 4,
"prerequisites": [
1,
2
],
"criteria": "Segmented images are saved to the specified folder `results/figures/`.",
"category": "Data preprocessing and postprocessing",
"satisfied": null
},
{
"requirement_id": 5,
"prerequisites": [
1,
2,
4
],
"criteria": "A GIF animation of images before and after the segmentation is generated and saved as `results/figures/segmentation_results.gif`.",
"category": "Visualization",
"satisfied": null
},
{
"requirement_id": 6,
"prerequisites": [
1,
2,
3,
4
],
"criteria": "A Jupyter Notebook is created containing the model architecture, the process of applying the pre-trained model, and segmentation results. It is converted to an HTML report and saved as `results/report.html`.",
"category": "Visualization",
"satisfied": null
}
] | [
{
"preference_id": 0,
"criteria": "The Jupyter Notebook should include well-documented code snippets explaining each step of the process.",
"satisfied": null
},
{
"preference_id": 1,
"criteria": "The GIF animation should clearly show the changes before and after segmentation over different images from the dataset.",
"satisfied": null
}
] | false | false | false | null |
31_Cancer_Prediction_SVM_BreastCancer_ML | Could you help me create a project for breast cancer prediction using an SVM model with the Breast Cancer Wisconsin dataset? Load the dataset and perform feature selection to identify important features in `src/data_loader.py`. Implement the SVM classifier for cancer prediction in `src/model.py`. Use cross-validation to evaluate the model in `src/train.py`. Save the confusion matrix as `results/figures/confusion_matrix.png`. Put together a detailed report that documents the entire process-from data preprocessing to model training and evaluation. The report should cover the feature selection process and include a clear heatmap of the performance metrics. Save the report as `results/metrics/breast_cancer_prediction_report.pdf`. | [
"Classification",
"Medical Analysis",
"Supervised Learning"
] | [
{
"requirement_id": 0,
"prerequisites": [],
"criteria": "The \"Breast Cancer Wisconsin\" dataset is used.",
"category": "Dataset or Environment",
"satisfied": null
},
{
"requirement_id": 1,
"prerequisites": [
0
],
"criteria": "Feature selection is performed to identify important features in `src/data_loader.py`.",
"category": "Data preprocessing and postprocessing",
"satisfied": null
},
{
"requirement_id": 2,
"prerequisites": [],
"criteria": "The \"SVM classifier\" is used for cancer prediction and should be implemented in `src/model.py`.",
"category": "Machine Learning Method",
"satisfied": null
},
{
"requirement_id": 3,
"prerequisites": [
1,
2
],
"criteria": "Cross-validation is used to evaluate the model in `src/train.py`.",
"category": "Performance Metrics",
"satisfied": null
},
{
"requirement_id": 4,
"prerequisites": [
1,
2,
3
],
"criteria": "The confusion matrix is printed and saved as `results/figures/confusion_matrix.png`.",
"category": "Visualization",
"satisfied": null
},
{
"requirement_id": 5,
"prerequisites": [
1,
2,
3,
4
],
"criteria": "A detailed report containing the data preprocessing, model training, and evaluation process is created and saved as `results/metrics/breast_cancer_prediction_report.pdf`.",
"category": "Other",
"satisfied": null
}
] | [
{
"preference_id": 0,
"criteria": "The feature selection process should be well-documented in the report, explaining why certain features were chosen.",
"satisfied": null
},
{
"preference_id": 1,
"criteria": "The heatmap should clearly distinguish between different performance metrics, such as precision, recall, and F1-score.",
"satisfied": null
},
{
"preference_id": 2,
"criteria": "The report should include a discussion on the model's performance and potential areas for improvement.",
"satisfied": null
}
] | false | true | false | null |
32_Weather_Data_Analysis_LinearRegression_Weather_ML | Develop a weather data analysis system using a Linear Regression model on the Weather dataset from Kaggle. Load the dataset and perform feature engineering, including feature selection and generation and handle missing data using mean imputation or interpolation in `src/data_loader.py`. Then, apply the Linear Regression model should be implemented in `src/model.py`. Visualize and save the correlation matrix in `results/figures/correlation_matrix.png` and the prediction results as a line plot with confidence intervals in `results/figures/prediction_results.png`. Finally, create a detailed report covering data preprocessing, feature engineering, model training, and prediction results. Save the report in `results/weather_analysis_report.pdf`. The feature engineering process should be well-documented. | [
"Regression",
"Supervised Learning"
] | [
{
"requirement_id": 0,
"prerequisites": [],
"criteria": "The \"Kaggle Weather\" dataset is loaded in `src/data_loader.py`.",
"category": "Dataset or Environment",
"satisfied": null
},
{
"requirement_id": 1,
"prerequisites": [
0
],
"criteria": "Feature engineering, including feature selection and generation, is performed in `src/data_loader.py`.",
"category": "Data preprocessing and postprocessing",
"satisfied": null
},
{
"requirement_id": 2,
"prerequisites": [
1
],
"criteria": "Missing data is handled using mean imputation or interpolation in `src/data_loader.py`.",
"category": "Data preprocessing and postprocessing",
"satisfied": null
},
{
"requirement_id": 3,
"prerequisites": [],
"criteria": "The \"Linear Regression\" model is used for weather data analysis and should be implemented in `src/model.py`.",
"category": "Machine Learning Method",
"satisfied": null
},
{
"requirement_id": 4,
"prerequisites": [
2,
3
],
"criteria": "The correlation matrix is saved as `results/figures/correlation_matrix.png`.",
"category": "Visualization",
"satisfied": null
},
{
"requirement_id": 5,
"prerequisites": [
2,
3
],
"criteria": "Prediction results are plotted and saved as a line plot with confidence intervals. The plot is saved as `results/figures/prediction_results.png`.",
"category": "Visualization",
"satisfied": null
},
{
"requirement_id": 6,
"prerequisites": [
2,
3,
5
],
"criteria": "A detailed report containing data preprocessing, feature engineering, model training, and prediction results is created and saved as `results/weather_analysis_report.pdf`.",
"category": "Other",
"satisfied": null
}
] | [
{
"preference_id": 0,
"criteria": "The feature engineering process should be clearly documented in the report, explaining the rationale behind feature selection and generation.",
"satisfied": null
},
{
"preference_id": 1,
"criteria": "The report should include a discussion on the correlation matrix, highlighting any interesting relationships between features.",
"satisfied": null
}
] | true | true | false | null |
33_Object_Detection_YOLOv3_COCO_DL | Help me develop an object detection system using the YOLOv3 model and the COCO dataset. Download the dataset and preprocess the images by resizing and normalization in `src/data_loader.py`. Implement the YOLOv3 model and use Non-Maximum Suppression (NMS) to refine the results in `src/model.py`. Save the detected objects to `results/figures/`, and create an interactive Streamlit web page in `src/app.py` to display the detection results. Finally, evaluate the model's performance, including metrics such as mAP and inference time, and save the evaluation results to `results/metrics/model_performance.txt`. The system should properly manage the launch and termination of the Streamlit application to prevent unnecessary resource usage. | [
"Computer Vision"
] | [
{
"requirement_id": 0,
"prerequisites": [],
"criteria": "The \"COCO\" dataset downloading is implemented in `src/data_loader.py`.",
"category": "Dataset or Environment",
"satisfied": null
},
{
"requirement_id": 1,
"prerequisites": [
0
],
"criteria": "Data preprocessing, including resizing and normalization of images, is performed in `src/data_loader.py`.",
"category": "Data preprocessing and postprocessing",
"satisfied": null
},
{
"requirement_id": 2,
"prerequisites": [],
"criteria": "The \"YOLOv3\" model is implemented in `src/model.py`.",
"category": "Machine Learning Method",
"satisfied": null
},
{
"requirement_id": 3,
"prerequisites": [
1,
2
],
"criteria": "\"Non-Maximum Suppression\" (NMS) is applied to refine detection results. Please implement this in `src/model.py`.",
"category": "Data preprocessing and postprocessing",
"satisfied": null
},
{
"requirement_id": 4,
"prerequisites": [
2,
3
],
"criteria": "Detection results are saved to the specified folder `results/figures/`.",
"category": "Visualization",
"satisfied": null
},
{
"requirement_id": 5,
"prerequisites": [
2,
3,
4
],
"criteria": "An interactive web page in `src/app.py` using \"Streamlit\" is created to display detection results saved in `results/figures/`.",
"category": "Human Computer Interaction",
"satisfied": null
},
{
"requirement_id": 6,
"prerequisites": [
2,
3
],
"criteria": "Model performance evaluation results are saved in `results/metrics/model_performance.txt`.",
"category": "Performance Metrics",
"satisfied": null
}
] | [
{
"preference_id": 0,
"criteria": "The \"Streamlit\" web page should be user-friendly, allowing users to easily upload and view new images for detection.",
"satisfied": null
},
{
"preference_id": 1,
"criteria": "The performence evalution includes mAP and inference time as metrics.",
"satisfied": null
},
{
"preference_id": 2,
"criteria": " The system should properly manage the launch and termination of the Streamlit application.",
"satisfied": null
}
] | false | true | false | null |
34_Customer_Segmentation_KMeans_CustomerSegmentation_ML | I need to create a customer segmentation system using the K-means clustering algorithm with the Kaggle Customer Segmentation dataset. Start by standardizing the data in `src/data_loader.py`, then use the elbow method to determine the optimal number of clusters and save the elbow plot to `results/figures/elbow.jpg`. Implement the K-means algorithm in `src/model.py`. Save the cluster centers in `results/metrics/cluster_centers.txt`. Visualize the segmentation results using seaborn and save the plot as `results/figures/customer_segmentation.png`. Create an interactive Dash dashboard allowing dynamic exploration of the segments. | [
"Unsupervised Learning"
] | [
{
"requirement_id": 0,
"prerequisites": [],
"criteria": "The \"Kaggle Customer Segmentation\" dataset is used, including data loading and preparation in `src/data_loader.py`.",
"category": "Dataset or Environment",
"satisfied": null
},
{
"requirement_id": 1,
"prerequisites": [
0
],
"criteria": "Data is standardized to ensure feature values are within the same range in `src/data_loader.py`.",
"category": "Data preprocessing and postprocessing",
"satisfied": null
},
{
"requirement_id": 2,
"prerequisites": [
1
],
"criteria": "The elbow method is used to determine the optimal number of clusters. Please save the elbow plot to `results/figures/elbow.jpg`.",
"category": "Machine Learning Method",
"satisfied": null
},
{
"requirement_id": 3,
"prerequisites": [],
"criteria": "The K-means clustering algorithm is implemented in `src/model.py`.",
"category": "Machine Learning Method",
"satisfied": null
},
{
"requirement_id": 4,
"prerequisites": [
2,
3
],
"criteria": "Cluster centers are saved in `results/metrics/cluster_centers.txt`.",
"category": "Save Trained Model",
"satisfied": null
},
{
"requirement_id": 5,
"prerequisites": [
2,
3,
4
],
"criteria": "The Customer segmentation is visualized using \"seaborn,\" with the plot saved as `results/figures/customer_segmentation.png`.",
"category": "Visualization",
"satisfied": null
},
{
"requirement_id": 6,
"prerequisites": [
2,
3,
4
],
"criteria": "An interactive dashboard which allows dynamic exploration of the segments is created using \"Dash\".",
"category": "Human Computer Interaction",
"satisfied": null
}
] | [
{
"preference_id": 0,
"criteria": "The elbow plot clearly shows how the optimal number of clusters is determined.",
"satisfied": null
},
{
"preference_id": 1,
"criteria": " The system properly manages the launch and termination of the dashboard.",
"satisfied": null
}
] | true | true | false | null |
35_Loan_Default_Prediction_RandomForest_LendingClub_ML | Can you help me build a loan default prediction system using a Random Forest classifier with the Lending Club Loan dataset? Start by loading the dataset, handling imbalanced data using oversampling or undersampling techniques, and performing feature selection to identify important features, all implemented in `src/data_loader.py`. Train a Random Forest model and save the trained model in `models/saved_models/`. Save the feature importances to `results/feature_importances.txt` and save the ROC curve as `results/figures/roc_curve.png` using matplotlib. Finally, create a detailed Markdown report summarizing the data preprocessing steps, model training, and evaluation process, and save it as `results/loan_default_prediction_report.md`. The report should include insights on model performance and suggestions for potential improvements. | [
"Classification",
"Supervised Learning"
] | [
{
"requirement_id": 0,
"prerequisites": [],
"criteria": "The \"Lending Club Loan\" dataset is loaded in `src/data_loader.py`.",
"category": "Dataset or Environment",
"satisfied": null
},
{
"requirement_id": 1,
"prerequisites": [
0
],
"criteria": "Imbalanced data is handled using oversampling or undersampling techniques, implemented in `src/data_loader.py`.",
"category": "Data preprocessing and postprocessing",
"satisfied": null
},
{
"requirement_id": 2,
"prerequisites": [
0
],
"criteria": "Feature selection is performed to identify important features in `src/data_loader.py`.",
"category": "Data preprocessing and postprocessing",
"satisfied": null
},
{
"requirement_id": 3,
"prerequisites": [
2
],
"criteria": "A \"Random Forest\" classifier is implemented for predicting loan default. Save the trained model in `models/saved_models/`.",
"category": "Machine Learning Method",
"satisfied": null
},
{
"requirement_id": 4,
"prerequisites": [
2,
3
],
"criteria": "Feature importances are saved as `results/feature_importances.txt`.",
"category": "Other",
"satisfied": null
},
{
"requirement_id": 5,
"prerequisites": [
2,
3
],
"criteria": "The \"ROC curve\" is visualized and saved using \"matplotlib\" at `results/figures/roc_curve.png`.",
"category": "Visualization",
"satisfied": null
},
{
"requirement_id": 6,
"prerequisites": [
2,
3,
5
],
"criteria": "A Markdown report containing the data preprocessing steps, model training, and evaluation process is created and saved as `results/loan_default_prediction_report.md`.",
"category": "Other",
"satisfied": null
}
] | [
{
"preference_id": 0,
"criteria": "The Markdown report is detailed.",
"satisfied": null
},
{
"preference_id": 1,
"criteria": "The Markdown report should include insights on model performance and suggestions for potential improvements.",
"satisfied": null
}
] | false | true | false | null |
36_Music_Emotion_Classification_SVM_GTZAN_ML | Help me develop a project for music emotion classification using an SVM model with the GTZAN dataset. The project should include audio preprocessing using librosa for noise removal and normalization, MFCC feature extraction with 13 coefficients, and the use of a linear SVM classifier with hyperparameter tuning. The dataset loading, audio preprocessing, including noise removal and normalization, and MFCC feature extraction must be implemented in `src/data_loader.py`. Implement the SVM classifier in `src/model.py`. Save the classification results to `results/predictions.txt`, visualize audio spectrograms with librosa (saving them to `results/figures/`), and create an interactive webpage in `src/app.py` with Streamlit that allows real-time audio file uploads and displays both classification results and spectrograms in `results/figures/`. Ensure efficient resource management with attention to automatically managing the launch and termination of the Streamlit webpage. | [
"Audio Processing",
"Classification"
] | [
{
"requirement_id": 0,
"prerequisites": [],
"criteria": "The \"GTZAN\" music emotion loaded in `src/data_loader.py`.",
"category": "Dataset or Environment",
"satisfied": null
},
{
"requirement_id": 1,
"prerequisites": [
0
],
"criteria": "Audio preprocessing, including noise removal and normalization, is performed in `src/data_loader.py`.",
"category": "Data preprocessing and postprocessing",
"satisfied": null
},
{
"requirement_id": 2,
"prerequisites": [
0,
1
],
"criteria": "MFCC feature extraction is implemented in `src/data_loader.py`.",
"category": "Data preprocessing and postprocessing",
"satisfied": null
},
{
"requirement_id": 3,
"prerequisites": [
1,
2
],
"criteria": "A \"SVM classifier\" is implemented in `src/model.py`.",
"category": "Machine Learning Method",
"satisfied": null
},
{
"requirement_id": 4,
"prerequisites": [
3
],
"criteria": "The classification results are saved in `results/predictions.txt`.",
"category": "Other",
"satisfied": null
},
{
"requirement_id": 5,
"prerequisites": [
0,
1,
2,
3
],
"criteria": "Audio spectrograms are visualized with \"librosa\" and saved to `results/figures/`.",
"category": "Visualization",
"satisfied": null
},
{
"requirement_id": 6,
"prerequisites": [
0,
1,
2,
3,
4,
5
],
"criteria": "An interactive web page is created in `src/app.py` using \"Streamlit\" to display classification results and spectrograms in `results/figures/`.",
"category": "Human Computer Interaction",
"satisfied": null
}
] | [
{
"preference_id": 0,
"criteria": "The \"Streamlit\" webpage should allow users to upload new audio files and view the classification results in real-time.",
"satisfied": null
},
{
"preference_id": 1,
"criteria": "The spectrogram visualizations should include options to adjust the frequency range and time resolution for deeper analysis.",
"satisfied": null
},
{
"preference_id": 2,
"criteria": "The system should perform efficient resource management especially on managing the launch and termination of the Streamlit webpage.",
"satisfied": null
}
] | false | true | false | null |
37_Lane_Detection_ResNet50_TuSimple_DL | Develop a lane detection system. Start by importing the standard pre-trained ResNet-50 model from PyTorch in `src/model.py`. We'll work here with the TuSimple lane detection dataset as our test dataset, which should be loaded through `src/data_loader.py`. Then load and preprocess the dataset, including data augmentation techniques such as random cropping, rotation, and scaling in `src/data_loader.py`. Fine-tune the model and save the detection accuracy in `results/metrics/detection_accuracy.txt`, and save the trained model as `models/saved_models/lane_detection_model.pth`. Split a subset of the data for validation, implemented in `src/data_loader.py`. Visualize detection results using matplotlib and save them to `results/figures/`. Create a detailed report of the entire process, including data preprocessing, model training, and evaluation, and save it as `results/lane_detection_report.pdf`. The report should also analyze the model's performance under challenging conditions such as curves or poor lighting. | [
"Computer Vision"
] | [
{
"requirement_id": 0,
"prerequisites": [],
"criteria": "The \"TuSimple\" lane detection dataset is loaded in `src/data_loader.py`.",
"category": "Dataset or Environment",
"satisfied": null
},
{
"requirement_id": 1,
"prerequisites": [
0
],
"criteria": "Data augmentation, including random cropping, rotation, and scaling, is performed in `src/data_loader.py`.",
"category": "Data preprocessing and postprocessing",
"satisfied": null
},
{
"requirement_id": 2,
"prerequisites": [
0
],
"criteria": "A subset of the data is split for validation and implemented in `src/data_loader.py`.",
"category": "Data preprocessing and postprocessing",
"satisfied": null
},
{
"requirement_id": 3,
"prerequisites": [],
"criteria": "The pre-trained \"ResNet-50\" model is imported from PyTorch in `src/model.py`.",
"category": "Machine Learning Method",
"satisfied": null
},
{
"requirement_id": 4,
"prerequisites": [
1,
2,
3
],
"criteria": "Fine tune the \"ResNet-50\" model and save it as `models/saved_models/lane_detection_model.pth`.",
"category": "Save Trained Model",
"satisfied": null
},
{
"requirement_id": 5,
"prerequisites": [
4
],
"criteria": "Detection accuracy is saved as `results/metrics/detection_accuracy.txt`.",
"category": "Performance Metrics",
"satisfied": null
},
{
"requirement_id": 6,
"prerequisites": [
4
],
"criteria": "Detection results are visualized with \"matplotlib\" and saved to `results/figures/`.",
"category": "Visualization",
"satisfied": null
},
{
"requirement_id": 7,
"prerequisites": [
0,
1,
2,
3,
4,
5
],
"criteria": "A detailed report containing data preprocessing, model training, and evaluation process is created and saved as `results/lane_detection_report.pdf`.",
"category": "Other",
"satisfied": null
}
] | [
{
"preference_id": 0,
"criteria": "The report should include an analysis of the model's performance on challenging scenarios, such as curves or poor lighting conditions.",
"satisfied": null
},
{
"preference_id": 1,
"criteria": "The data augmentation steps should be well-documented, with examples of augmented images included in the report.",
"satisfied": null
}
] | false | true | false | null |
38_Object_Tracking_Siamese_OTB50_DL | I need to create a system for object tracking using a Siamese network and the OTB50 dataset. The OTB50 dataset should be loaded in `src/data_loader.py`. The system should include data augmentation steps such as rotation and scaling, performed in `src/data_loader.py`. Implement the Siamese network in `src/model.py`. Hyperparameters, such as learning rate and batch size, should be tuned in `src/train.py`. The tracking results should be saved as `results/tracking_results.txt`. Visualize the tracking results with OpenCV and save tracking videos under `results/videos/`. Additionally, create a comprehensive Markdown report that includes details of data preprocessing, model training, and evaluation process and save it as `results/object_tracking_report.md`. Ensure that the system can process new video sequences with minimal adjustments for flexible application. The Markdown report should include a section analyzing the impact of different hyperparameters on the tracking performance. | [
"Computer Vision"
] | [
{
"requirement_id": 0,
"prerequisites": [],
"criteria": "The \"OTB50\" dataset is loaded in `src/data_loader.py`.",
"category": "Dataset or Environment",
"satisfied": null
},
{
"requirement_id": 1,
"prerequisites": [
0
],
"criteria": "Data augmentation, such as rotation and scaling, is performed in `src/data_loader.py`.",
"category": "Data preprocessing and postprocessing",
"satisfied": null
},
{
"requirement_id": 2,
"prerequisites": [],
"criteria": "A \"Siamese\"network is implemented in `src/model.py`.",
"category": "Machine Learning Method",
"satisfied": null
},
{
"requirement_id": 3,
"prerequisites": [
0,
1,
2
],
"criteria": "Hyperparameters, such as learning rate and batch size, are tuned in `src/train.py`.",
"category": "Machine Learning Method",
"satisfied": null
},
{
"requirement_id": 4,
"prerequisites": [
0,
1,
2,
3
],
"criteria": "The tracking results are saved as `results/tracking_results.txt`.",
"category": "Other",
"satisfied": null
},
{
"requirement_id": 5,
"prerequisites": [
0,
1,
2,
3
],
"criteria": "Tracking results are visualized with OpenCV and saved to `results/videos/`.",
"category": "Visualization",
"satisfied": null
},
{
"requirement_id": 6,
"prerequisites": [
0,
1,
2,
3
],
"criteria": "A detailed Markdown document containing data preprocessing, model training, and evaluation processes is created and saved as `results/object_tracking_report.md`.",
"category": "Other",
"satisfied": null
},
{
"requirement_id": 7,
"prerequisites": [
6
],
"criteria": "The Markdown report should include a section analyzing the impact of different hyperparameters on tracking performance.",
"category": null,
"satisfied": null
}
] | [
{
"preference_id": 0,
"criteria": "The tracking videos should be saved in high resolution and include annotations that highlight the tracked object.",
"satisfied": null
},
{
"preference_id": 1,
"criteria": "Ensure the system is capable of processing new video sequences with minimal modification, allowing for flexible use cases.",
"satisfied": null
}
] | false | true | false | null |
39_Drug_Response_Prediction_SVM_GDSC_ML | Develop a system to predict drug response using the GDSC dataset with a Support Vector Machine (SVM) regressor. Load the dataset and perform feature selection to identify key features in `src/data_loader.py`. Implement the SVM regressor in `src/model.py`. Use cross-validation to evaluate the model's performance in `src/train.py`. Save the performance results to `results/metrics/performance.txt`. Visualize the regression results using seaborn and save it under `results/figures/`. Next, create a report including the data preprocessing, model training, evaluation process, and the visualization. Save the report as `results/drug_response_prediction_report.pdf`. The report should emphasize how feature selection impacts the model's performance, and the regression results visualization should clearly highlight the relationship between the selected features and the predicted drug response. Ensure the system is designed to be easily extendable for incorporating additional datasets or new features. | [
"Medical Analysis",
"Regression",
"Supervised Learning"
] | [
{
"requirement_id": 0,
"prerequisites": [],
"criteria": "The \"GDSC\" drug response dataset is loaded in `src/data_loader.py`.",
"category": "Dataset or Environment",
"satisfied": null
},
{
"requirement_id": 1,
"prerequisites": [
0
],
"criteria": "Feature selection is performed to identify important features in `src/data_loader.py`.",
"category": "Data preprocessing and postprocessing",
"satisfied": null
},
{
"requirement_id": 2,
"prerequisites": [],
"criteria": "The \"SVM regressor\" is implemented in `src/model.py`.",
"category": "Machine Learning Method",
"satisfied": null
},
{
"requirement_id": 3,
"prerequisites": [
1,
2
],
"criteria": "Cross-validation is used to evaluate the model in `src/train.py`.",
"category": "Performance Metrics",
"satisfied": null
},
{
"requirement_id": 4,
"prerequisites": [
0,
1,
2,
3
],
"criteria": "The performance results are saved as `results/metrics/performance.txt`.",
"category": "Performance Metrics",
"satisfied": null
},
{
"requirement_id": 5,
"prerequisites": [
0,
1,
2,
3
],
"criteria": "The regression results are visualized using \"seaborn,\" and saved to `results/figures/`.",
"category": "Visualization",
"satisfied": null
},
{
"requirement_id": 6,
"prerequisites": [
0,
1,
2,
3,
4,
5
],
"criteria": "A report containing data preprocessing, model training, evaluation process, and the regression results visualization, is created and saved as `results/drug_response_prediction_report.pdf`.",
"category": "Other",
"satisfied": null
}
] | [
{
"preference_id": 0,
"criteria": "The report should emphasize how feature selection impacts the model's performance.",
"satisfied": null
},
{
"preference_id": 1,
"criteria": "The regression results visualization should clearly highlight the relationship between the selected features and the predicted drug response.",
"satisfied": null
},
{
"preference_id": 2,
"criteria": "Ensure that the system can be easily extended to incorporate additional datasets or new features without significant rework.",
"satisfied": null
}
] | false | true | false | null |
40_Text_Summarization_BART_CNNDailyMail_DL | Develop a system that performs text summarization system using the BART model with the CNN/Daily Mail dataset. Start by loading and preparing the dataset in `src/data_loader.py`, then perform data preprocessing such as removing HTML tags and punctuation in `src/data_loader.py`. Import a pre-trained BART model for text summarization in `src/model.py` to generate summaries. Save the generated summaries to `results/summaries.txt`. Visualize the length distribution of these summaries using seaborn and save the visualization to `results/figures/summary_length_distribution.png`. Additionally, implement an interactive Streamlit web page in `src/visualize.py`, which allows users to view input texts and their generated summaries. Finally, generate a report covering data preprocessing and generation results, and save it as `results/text_summarization_report.pdf`. | [
"Generative Models",
"Natural Language Processing"
] | [
{
"requirement_id": 0,
"prerequisites": [],
"criteria": "The \"CNN/Daily Mail\" news dataset is used, including loading and preparing the dataset in `src/data_loader.py`.",
"category": "Dataset or Environment",
"satisfied": null
},
{
"requirement_id": 1,
"prerequisites": [
0
],
"criteria": "Data preprocessing is performed in `src/data_loader.py`, including removing HTML tags and punctuation.",
"category": "Data preprocessing and postprocessing",
"satisfied": null
},
{
"requirement_id": 2,
"prerequisites": [],
"criteria": "A pre-trained \"BART\" model is imported for text summarization in `src/model.py`.",
"category": "Machine Learning Method",
"satisfied": null
},
{
"requirement_id": 3,
"prerequisites": [
1,
2
],
"criteria": "The generated summary results are saved in `results/summary_results.txt`.",
"category": "Other",
"satisfied": null
},
{
"requirement_id": 4,
"prerequisites": [
3
],
"criteria": "The length distribution of the generated summaries is visualized using \"seaborn,\" and the plot is saved as `results/figures/summary_length_distribution.png`.",
"category": "Visualization",
"satisfied": null
},
{
"requirement_id": 5,
"prerequisites": [
3
],
"criteria": "An interactive web page is created using \"Streamlit\" to display input texts and their generated summaries and implemented in `src/visualize.py`.",
"category": "Human Computer Interaction",
"satisfied": null
},
{
"requirement_id": 6,
"prerequisites": [
3
],
"criteria": "A report covering data preprocessing, model training, and generation results is generated and saved as `results/text_summarization_report.pdf`.",
"category": "Other",
"satisfied": null
}
] | [
{
"preference_id": 0,
"criteria": "The interactive \"Streamlit\" webpage should allow users to input new text and generate summaries in real-time.",
"satisfied": null
},
{
"preference_id": 1,
"criteria": "The report should include a discussion on how different hyperparameter settings affected the model's performance.",
"satisfied": null
},
{
"preference_id": 2,
"criteria": "During development, the \"Streamlit\" application should be efficiently managed to avoid unnecessary resource usage.",
"satisfied": null
}
] | false | false | false | null |
41_Stock_Classification_KNN_YahooFinance_ML | Develop a stock classification system using a KNN model on the Yahoo Finance dataset. Your implementation should decide if a given stock will increase or decrease in price. Start by loading the dataset and performing feature engineering, including generating technical indicators and selecting the most relevant features in `src/data_loader.py`. Standardize the data to ensure feature values are within the same range in `src/data_loader.py`. Apply the KNN classifier to classify stocks based on the engineered features, and save the implementation in `src/model.py`. Next, save the classification results to `results/classification_results.txt`, and visualize the correlation between the technical indicators and the classification result as a heatmap using seaborn. Save the headmap as `results/figures/feature_correlation_heatmap.png`. Finally, create an interactive Jupyter Notebook under `results/` that explains the process, showcases the classification results, and will help ease future updates that introduce new data. | [
"Classification",
"Financial Analysis",
"Supervised Learning"
] | [
{
"requirement_id": 0,
"prerequisites": [],
"criteria": "The \"Yahoo Finance\" dataset is used, including data loading and preparation in `src/data_loader.py`.",
"category": "Dataset or Environment",
"satisfied": null
},
{
"requirement_id": 1,
"prerequisites": [
0
],
"criteria": "Feature engineering is performed, including generating technical indicators and conducting feature selection in `src/data_loader.py`.",
"category": "Data preprocessing and postprocessing",
"satisfied": null
},
{
"requirement_id": 2,
"prerequisites": [
0
],
"criteria": "Data is standardized to ensure feature values are within the same range in `src/data_loader.py`.",
"category": "Data preprocessing and postprocessing",
"satisfied": null
},
{
"requirement_id": 3,
"prerequisites": [
2
],
"criteria": "The \"KNN classifier\" is applied to classify stocks based on the engineered features. Please save the implementation in `src/model.py`.",
"category": "Machine Learning Method",
"satisfied": null
},
{
"requirement_id": 4,
"prerequisites": [
3
],
"criteria": "The classification results are saved in `results/classification_results.txt`.",
"category": "Other",
"satisfied": null
},
{
"requirement_id": 5,
"prerequisites": [
4
],
"criteria": "A heatmap representing the correlations between the technical indicators and the classification results is saved as `results/figures/feature_correlation_heatmap.png`.",
"category": "Visualization",
"satisfied": null
},
{
"requirement_id": 6,
"prerequisites": [
4
],
"criteria": "An interactive \"Jupyter Notebook\" is created under `results/` to explain the process and showcase the classification results.",
"category": "Human Computer Interaction",
"satisfied": null
}
] | [
{
"preference_id": 0,
"criteria": "The Jupyter Notebook should include clear explanations of each step, including feature engineering and model evaluation.",
"satisfied": null
},
{
"preference_id": 1,
"criteria": "The correlation heatmap should highlight the most significant technical indicators and provide insights into their relationships.",
"satisfied": null
},
{
"preference_id": 2,
"criteria": "The system should allow easy updates with new data, making the notebook flexible for future analysis.",
"satisfied": null
}
] | false | true | false | null |
42_Medical_Image_Classification_DenseNet121_ChestXray_DL | Create a medical image classification system using a pre-trained DenseNet-121 model and the Kaggle Chest X-ray dataset. Start by loading and preprocessing the dataset and performing data augmentation (including rotation, translation, and scaling) in `src/data_loader.py`. Apply the DenseNet-121 model for classification, recording the accuracy and saving it to `results/metrics/classification_accuracy.txt`. Fine-tune the model and save it as `models/saved_models/chest_xray_densenet_model.pth`. Use Grad-CAM to visualize the model's decision-making process and save these visualizations as `results/figures/grad_cam_visualizations.gif`. Finally, create a Markdown report that documents the model architecture, training process, data augmentation techniques, and analysis of the results, and save it as `results/medical_image_classification_report.md`. It would also be nice if the system was flexible such that the DenseNet-121 could be easily further fine-tuned by a human user. | [
"Classification",
"Computer Vision",
"Medical Analysis",
"Supervised Learning"
] | [
{
"requirement_id": 0,
"prerequisites": [],
"criteria": "The \"Kaggle Chest X-ray\" dataset is used, with data loading and preprocessing implemented in `src/data_loader.py`.",
"category": "Dataset or Environment",
"satisfied": null
},
{
"requirement_id": 1,
"prerequisites": [
0
],
"criteria": "Data augmentation is performed, including rotation, translation, and scaling of images in `src/data_loader.py`.",
"category": "Data preprocessing and postprocessing",
"satisfied": null
},
{
"requirement_id": 2,
"prerequisites": [
1
],
"criteria": "The pre-trained \"DenseNet-121\" model is fine-tuned saved in `models/saved_models/`.",
"category": "Machine Learning Method",
"satisfied": null
},
{
"requirement_id": 3,
"prerequisites": [
1,
2
],
"criteria": "Classification accuracy is printed and saved as `results/metrics/classification_accuracy.txt`.",
"category": "Performance Metrics",
"satisfied": null
},
{
"requirement_id": 4,
"prerequisites": [
2,
3
],
"criteria": "\"Grad-CAM\" is used to visualize model decisions, saving the visualizations as `results/figures/grad_cam_visualizations.gif`.",
"category": "Visualization",
"satisfied": null
},
{
"requirement_id": 5,
"prerequisites": [
2,
3
],
"criteria": "A \"Markdown\" report is created containing the model architecture, training process, data augmentation, and result analysis, and saved as `results/medical_image_classification_report.md`.",
"category": "Other",
"satisfied": null
}
] | [
{
"preference_id": 0,
"criteria": "The \"Markdown\" report should include a section explaining the impact of data augmentation on model performance.",
"satisfied": null
},
{
"preference_id": 1,
"criteria": "The \"Grad-CAM\" visualizations should clearly highlight the areas of the images that contributed most to the model's decisions.",
"satisfied": null
},
{
"preference_id": 2,
"criteria": "The system should be flexible to allow further fine-tuning of the \"DenseNet-121\" model.",
"satisfied": null
}
] | true | true | false | null |
43_Social_Network_Analysis_GCN_Cora_ML | Hey! Could you help me create a social network analysis system using a GCN model with the Cora citation network dataset? First, let's load and preprocess the dataset, including normalization and denoising, in `src/data_loader.py`. Then, apply the GCN model to classify the nodes and tune the hyperparameters such as the learning rate and hidden layer size to get the best results in `src/train.py`. Save the model under `models/saved_models/`. Once you've done that, please save the node classification performance to `results/metrics/node_classification_results.txt`. Visualize the citation network structure and save it as `results/figures/citation_network_visualization.png`. Lastly, create an interactive network graph using either D3.js or Bokeh to showcase the node classification results and network visualization in `results/figures/`. It would also be great if your implementation could allow a programmer to easily swap to other citation datasets. Thanks a lot for your help! | [
"Unsupervised Learning"
] | [
{
"requirement_id": 0,
"prerequisites": [],
"criteria": "The \"Cora citation network\" dataset is loaded in `src/data_loader.py`.",
"category": "Dataset or Environment",
"satisfied": null
},
{
"requirement_id": 1,
"prerequisites": [
0
],
"criteria": "Data preprocessing is performed, including normalization and denoising, in `src/data_loader.py`.",
"category": "Data preprocessing and postprocessing",
"satisfied": null
},
{
"requirement_id": 2,
"prerequisites": [
1
],
"criteria": "Hyperparameters such as learning rate and hidden layer size are tuned to optimize the model in `src/train.py`.",
"category": "Machine Learning Method",
"satisfied": null
},
{
"requirement_id": 3,
"prerequisites": [
2
],
"criteria": "The model is saved under `models/saved_models/`.",
"category": "Save Trained Model",
"satisfied": null
},
{
"requirement_id": 4,
"prerequisites": [
2
],
"criteria": "Node classification performance are saved in `results/metrics/node_classification_results.txt`.",
"category": "Performence Metrics",
"satisfied": null
},
{
"requirement_id": 5,
"prerequisites": [
2
],
"criteria": "The citation network structure is visualized and saved as `results/figures/citation_network_visualization.png`.",
"category": "Visualization",
"satisfied": null
},
{
"requirement_id": 6,
"prerequisites": [
4,
5
],
"criteria": "An interactive network graph is created using \"D3.js\" or \"Bokeh\" to showcase the node classification results and network visualization in `results/figures/`.",
"category": "Visualization",
"satisfied": null
}
] | [
{
"preference_id": 0,
"criteria": "The interactive network graph should allow users to explore individual nodes and their classifications dynamically.",
"satisfied": null
},
{
"preference_id": 1,
"criteria": "The citation network visualization should clearly differentiate between different node classes and relationships.",
"satisfied": null
},
{
"preference_id": 2,
"criteria": "The system should be designed to handle additional citation datasets with minimal modification.",
"satisfied": null
}
] | false | true | false | null |
44_Text_Classification_BERT_AGNews_DL | Hey! Could you help me build a text classification system using a pretrained BERT model on the AG News dataset? Start by loading and preprocessing the data in `src/data_loader.py` (including removing whatever noise you can and performing tokenization). Once that's done, please save the BERT model parameters under `models/saved_models/`. Apply the BERT model and save the classification results to `results/results.txt`. Also, visualize the confusion matrix using seaborn and save it as `results/figures/confusion_matrix.png`. Finally, create an interactive Jupyter Notebook to display the input texts alongside their classification results under `results/`. It would be great if the notebook explained how transfer learning was used and its impact on the model's performance. Likewise, it would be good if your implementation is straightforward to swap out the dataset, including the code to retrain BERT. Thanks a bunch! | [
"Classification",
"Natural Language Processing",
"Supervised Learning"
] | [
{
"requirement_id": 0,
"prerequisites": [],
"criteria": "The \"AG News\" dataset is loaded in `src/data_loader.py`.",
"category": "Dataset or Environment",
"satisfied": null
},
{
"requirement_id": 1,
"prerequisites": [
0
],
"criteria": "Data preprocessing is performed in `src/data_loader.py`, including noise removal and tokenization.",
"category": "Data preprocessing and postprocessing",
"satisfied": null
},
{
"requirement_id": 2,
"prerequisites": [
1
],
"criteria": "The \"BERT\" model is applied for text classification and the parameters are saved under `models/saved_models/`.",
"category": "Machine Learning Method",
"satisfied": null
},
{
"requirement_id": 3,
"prerequisites": [
2
],
"criteria": "The classification results are saved as `results/results.txt`.",
"category": "Other",
"satisfied": null
},
{
"requirement_id": 4,
"prerequisites": [
2
],
"criteria": "The confusion matrix of classification result is visualized using \"seaborn,\" and saved as `results/figures/confusion_matrix.png`.",
"category": "Visualization",
"satisfied": null
},
{
"requirement_id": 5,
"prerequisites": [
3
],
"criteria": "An interactive \"Jupyter Notebook\" is created to display input texts and their classification results under `results`.",
"category": "Human Computer Interaction",
"satisfied": null
}
] | [
{
"preference_id": 0,
"criteria": "The Jupyter Notebook should explain how transfer learning was applied and its impact on model performance.",
"satisfied": null
},
{
"preference_id": 1,
"criteria": "The confusion matrix visualization should clearly differentiate between correctly and incorrectly classified samples.",
"satisfied": null
},
{
"preference_id": 2,
"criteria": "The system should allow for easy retraining of the \"BERT\" model with new data.",
"satisfied": null
}
] | false | true | false | null |
45_Product_Recommendation_MatrixFactorization_AmazonReviews_ML | Could you help me set up a product recommendation system using a matrix factorization algorithm with the Electronics subset of the Amazon Reviews 2023 dataset? You should handle data loading and all the data preprocessing, including noise removal and normalization in `src/data_loader.py`. Apply a latent factor model to compute user-item interactions and save the implementation in `src/model.py`. Print and save the recommendation results to `results/recommendation_results.txt`. Then visualize these recommendations using the Plotly library and save the visualization as `results/figures/recommendation_visualization.html`. Finally, generate an analysis report covering data preprocessing, model training, and results, should be saved as `results/recommendation_report.md`. | [
"Recommender Systems"
] | [
{
"requirement_id": 0,
"prerequisites": [],
"criteria": "The \"Electronics\" subset of the \"Amazon Reviews 2023\" dataset is loaded in `src/data_loader.py`.",
"category": "Dataset or Environment",
"satisfied": null
},
{
"requirement_id": 1,
"prerequisites": [
0
],
"criteria": "Data preprocessing is performed, including noise removal and normalization in `src/data_loader.py`.",
"category": "Data preprocessing and postprocessing",
"satisfied": null
},
{
"requirement_id": 2,
"prerequisites": [],
"criteria": "A \"Latent Factor model\" to computer user-item interactions is implemented in `src/model.py`.",
"category": "Machine Learning Method",
"satisfied": null
},
{
"requirement_id": 3,
"prerequisites": [
0,
2,
3
],
"criteria": "Recommendation results are saved as `results/recommendation_results.txt`.",
"category": "Other",
"satisfied": null
},
{
"requirement_id": 4,
"prerequisites": [
0,
2,
3,
4
],
"criteria": "Recommendation results are visualized using \"Plotly\" and saved as `results/figures/recommendation_visualization.html`.",
"category": "Visualization",
"satisfied": null
},
{
"requirement_id": 5,
"prerequisites": [
0,
2,
3,
4
],
"criteria": "An analysis report containing data preprocessing, model training, and recommendation results is generated and saved as `results/recommendation_report.md`.",
"category": "Other",
"satisfied": null
}
] | [
{
"preference_id": 0,
"criteria": "The impact of different preprocessing steps on recommendation accuracy should be discussed in the analysis report.",
"satisfied": null
},
{
"preference_id": 1,
"criteria": "The visualization should be interactive, allowing users to explore the recommendation results for different products.",
"satisfied": null
},
{
"preference_id": 2,
"criteria": "The system should be designed to easily incorporate additional user behavior data or product features for future improvements.",
"satisfied": null
}
] | false | true | false | null |
46_Speech_Recognition_DeepSpeech_LibriSpeech_DL | I'd like to develop a speech recognition system using the DeepSpeech library and the LibriSpeech dataset for me. Could you implement data loading and audio preprocessing, including noise reduction and normalization, in `src/data_loader.py`? Tune the hyperparameters such as learning rate and batch size in `src/train.py`. Please save the recognition results in `results/recognition_results.txt`. Next, create visualizations of the audio processing stages (like waveform and spectrogram) and save them as `results/figures/audio_visualization.png`. Generate a detailed report on recognition accuracy, error analysis, and suggestions for future improvements, and save it as `results/recognition_report.md`. Additionally, document the setup process for DeepSpeech, with tips for common installation issues, with [DeepSpeech documentation](https://deepspeech.readthedocs.io/en/r0.9/) as a reference. Save the final model in `models/saved_models/`. Thanks in advance! | [
"Audio Processing"
] | [
{
"requirement_id": 0,
"prerequisites": [],
"criteria": "\"LibriSpeech\" dataset is loaded in `src/data_loader.py`.",
"category": "Dataset or Environment",
"satisfied": null
},
{
"requirement_id": 1,
"prerequisites": [
0
],
"criteria": "Audio preprocessing, including noise reduction and normalization, is performed in `src/data_loader.py`.",
"category": "Data preprocessing and postprocessing",
"satisfied": null
},
{
"requirement_id": 2,
"prerequisites": [
1
],
"criteria": "Hyperparameters such as learning rate and batch size are tuned in `src/train.py`.",
"category": "Machine Learning Method",
"satisfied": null
},
{
"requirement_id": 3,
"prerequisites": [
2
],
"criteria": "Save the speech recognition model in `models/saved_models/`.",
"category": "Save Trained Model",
"satisfied": null
},
{
"requirement_id": 4,
"prerequisites": [
2
],
"criteria": "Recognition results are saved as `results/recognition_results.txt`.",
"category": "Other",
"satisfied": null
},
{
"requirement_id": 5,
"prerequisites": [
1
],
"criteria": "Visualizations of audio processing, like waveform and spectrogram, are generated and saved as `results/figures/audio_visualization.png`.",
"category": "Visualization",
"satisfied": null
},
{
"requirement_id": 6,
"prerequisites": [
2
],
"criteria": "A report containing recognition accuracy, error analysis, and future improvement suggestions is generated and saved as `results/recognition_report.md`.",
"category": "Performance Metrics",
"satisfied": null
}
] | [
{
"preference_id": 0,
"criteria": "The installation process for the \"DeepSpeech\" library should be well-documented, with troubleshooting tips if the library fails to install. Refer to the [DeepSpeech documentation](https://deepspeech.readthedocs.io/en/r0.9/) for guidance.",
"satisfied": null
},
{
"preference_id": 1,
"criteria": "The visualizations should clearly depict the stages of audio processing, making it easy to interpret the effects of preprocessing.",
"satisfied": null
},
{
"preference_id": 2,
"criteria": "The report should include recommendations for alternative models or approaches if the \"DeepSpeech\" library proves challenging to implement.",
"satisfied": null
}
] | false | true | true | null |
47_Network_Traffic_Analysis_KMeans_NetworkTraffic_ML | Develop a network traffic analysis system using the K-means clustering algorithm with the Network Intrusion dataset (CIC-IDS-2017) from Kaggle. Load the dataset and standardize the data to ensure feature values are within the same range in `src/data_loader.py`. Implement the K-means clustering algorithm in `src/model.py`. Evaluate the clusters using the silhouette coefficient and save the evaluation results under `results/metrics/`. Save the clustering results as `results/clustering_results.txt`. Visualize the clustering outcomes and save the visuals as `results/figures/network_traffic_visualization.png`. Create an interactive dashboard with Dash or Bokeh to explore the clustering results, and save the dashboard under `results/`. Ensure the system is modular so that a user could quickly change the clustering algorithm. | [
"Unsupervised Learning"
] | [
{
"requirement_id": 0,
"prerequisites": [],
"criteria": "\"Network Intrusion dataset (CIC-IDS-2017)\" from Kaggle is loaded in `src/data_loader.py`.",
"category": "Dataset or Environment",
"satisfied": null
},
{
"requirement_id": 1,
"prerequisites": [
0
],
"criteria": "Data is standardized to ensure feature values are within the same range in `src/data_loader.py`.",
"category": "Data preprocessing and postprocessing",
"satisfied": null
},
{
"requirement_id": 2,
"prerequisites": [],
"criteria": "\"K-means\" clustering algorithm is implemented in `src/model.py`.",
"category": "Machine Learning Method",
"satisfied": null
},
{
"requirement_id": 3,
"prerequisites": [
1,
2
],
"criteria": "The \"silhouette coefficient\" is used for evaluation. The evaluation results are saved under `results/metrics/`.",
"category": "Performance Metrics",
"satisfied": null
},
{
"requirement_id": 4,
"prerequisites": [
1,
2
],
"criteria": "Clustering results are printed and saved as `results/clustering_results.txt`.",
"category": "Other",
"satisfied": null
},
{
"requirement_id": 5,
"prerequisites": [
4
],
"criteria": "Network traffic clustering is visualized and saved as `results/figures/network_traffic_visualization.png`.",
"category": "Visualization",
"satisfied": null
},
{
"requirement_id": 6,
"prerequisites": [
4
],
"criteria": "An interactive dashboard using \"Dash\" or \"Bokeh\" is created to showcase clustering results and saved under `results/`.",
"category": "Visualization",
"satisfied": null
}
] | [
{
"preference_id": 0,
"criteria": "The dashboard should allow users to filter and drill down into specific clusters for detailed analysis.",
"satisfied": null
},
{
"preference_id": 1,
"criteria": "Visualizations should clearly distinguish between different clusters, making it easy to identify patterns in the network traffic data.",
"satisfied": null
},
{
"preference_id": 2,
"criteria": "The project should be modular, allowing a user to easily swap the clustering algorithm.",
"satisfied": null
}
] | true | true | false | null |
48_Stock_Trading_Simulation_PPO_HistoricalData_RL | Hey! I'm interested in developing a stock trading agent using the Proximal Policy Optimization (PPO) algorithm. The idea is to use historical market data for training and testing. A stock trading simulation environment should be implemented in `src/env.py`. The Proximal Policy Optimization (PPO) algorithm should be implemented in `src/train.py`. Please save the trained agent under `models/saved_models/`. Record all the trade decisions in `results/trade_decisions.txt` and save the total profit in `results/metrics/total_profit.txt`. Visualize the profit curve and save it as `results/figures/profit_curve.png`. Generate a report that covers the trading strategy, profit, and risk analysis, and save it as `results/trading_strategy_report.md`. Implement an interactive tool using Streamlit in `src/visualize.py` that allows users to try different parameters and run simulations. | [
"Financial Analysis",
"Reinforcement Learning"
] | [
{
"requirement_id": 0,
"prerequisites": [],
"criteria": "A stock trading simulation environment is implemented in `src/env.py`.",
"category": "Dataset or Environment",
"satisfied": null
},
{
"requirement_id": 1,
"prerequisites": [
0
],
"criteria": "Historical market data is used for training and testing.",
"category": "Dataset or Environment",
"satisfied": null
},
{
"requirement_id": 2,
"prerequisites": [],
"criteria": "The \"Proximal Policy Optimization (PPO)\" algorithm is implemented in `src/train.py`.",
"category": "Machine Learning Method",
"satisfied": null
},
{
"requirement_id": 3,
"prerequisites": [
1,
2
],
"criteria": "Trade decisions are recorded and saved as `results/trade_decisions.txt`.",
"category": "Other",
"satisfied": null
},
{
"requirement_id": 4,
"prerequisites": [
3
],
"criteria": "Total profit is saved as `results/metrics/total_profit.txt`.",
"category": "Other",
"satisfied": null
},
{
"requirement_id": 5,
"prerequisites": [
4
],
"criteria": "The profit curve is visualized and saved as `results/figures/profit_curve.png`.",
"category": "Visualization",
"satisfied": null
},
{
"requirement_id": 6,
"prerequisites": [
4
],
"criteria": "A report containing trading strategy, profit, and risk analysis is generated and saved as `results/trading_strategy_report.md`.",
"category": "Other",
"satisfied": null
},
{
"requirement_id": 7,
"prerequisites": [
1,
2
],
"criteria": "An interactive tool allowing users to try different parameters and run simulations using \"Streamlit\" is implemented in `src/visualize.py`.",
"category": "Human Computer Interaction",
"satisfied": null
}
] | [
{
"preference_id": 0,
"criteria": "The profit curve visualization should highlight significant trades or events that impacted performance.",
"satisfied": null
},
{
"preference_id": 1,
"criteria": "The report should include insights on how parameter tuning affects the trading outcome.",
"satisfied": null
}
] | false | true | false | null |
49_Explainable_AI_LIME_Titanic_ML | Hi there! I'm looking to create a project that explains model predictions using LIME, specifically with the Titanic survival prediction dataset. First, load the dataset in `src/data_loader.py`.Then, train a Random Forest classifier and save it under `models/saved_models/`? Finally, use LIME to explain the Random Forest classifier predictions and implement it in `src/visualize.py`. Generate a report including the explanations and save it as `results/model_explanation.md`. The report should be built with either Dash or Bokeh, implemented in `src/report.py`, so users can explore how different features affect the model's predictions. The explanation should be clear and easy to understand for non-tech folks. Additionally, save a well-labeled intuitive feature importance plot in `results/figures/feature_importance.png`. Thanks! | [
"Classification"
] | [
{
"requirement_id": 0,
"prerequisites": [],
"criteria": "The \"Titanic\" survival prediction dataset is loaded in `src/data_loader.py`.",
"category": "Dataset or Environment",
"satisfied": null
},
{
"requirement_id": 1,
"prerequisites": [
0
],
"criteria": "A \"Random Forest classifier\" is trained for survival prediction.",
"category": "Machine Learning Method",
"satisfied": null
},
{
"requirement_id": 2,
"prerequisites": [
0,
1
],
"criteria": "\"LIME\" is used for model prediction explanation and implemented in `src/visualize.py`.",
"category": "Human Computer Interaction",
"satisfied": null
},
{
"requirement_id": 3,
"prerequisites": [
0,
1,
2
],
"criteria": "A model prediction explanation report is generated and saved as `results/model_explanation.md`.",
"category": "Other",
"satisfied": null
},
{
"requirement_id": 4,
"prerequisites": [
2
],
"criteria": "A feature importance plot is saved as `results/figures/feature_importance.png`.",
"category": "Visualization",
"satisfied": null
},
{
"requirement_id": 5,
"prerequisites": [
0,
1,
2,
4
],
"criteria": "An interactive report showcasing the impact of different features on predictions is created using \"Dash\" or \"Bokeh\" and implemented in `src/report.py`.",
"category": "Other",
"satisfied": null
},
{
"requirement_id": 6,
"prerequisites": [
1
],
"criteria": "The trained model is saved under `models/saved_models/`.",
"category": "Save Trained Model",
"satisfied": null
}
] | [
{
"preference_id": 0,
"criteria": "The explanation report should be written in a clear and accessible style, making it understandable even for those without a deep technical background.",
"satisfied": null
},
{
"preference_id": 1,
"criteria": "The feature importance plot should be visually intuitive, with clear labels and descriptions.",
"satisfied": null
}
] | false | true | false | null |
50_Math_Problem_Solving_Transformer_DeepMindMath_DL | Hi! I need help with a project that uses a Transformer model to solve math problems from the DeepMind Mathematics dataset. Please load the dataset and preprocessing it in `src/data_loader.py`. The preprocessing should parse and standardize the math expressions in a syntactically consistent way so the model can easily process them. Implement the Transformer in `src/model.py`. Also, tune the hyperparameters such as the learning rate and the batch size in `src/train.py`, and save the training loss curve to `results/figures/training_loss_curve.png`. Sample and save some Transformer generated solutions in `results/sample_solutions.txt`. Using your model, create a simple interactive tool with Gradio or Streamlit in `src/interface.py` that can solve various user given math problems. Lastly, generate a report on how the model performs with different types of problems, including model accuracy, error analysis, and future improvement suggestions. Save it as `results/metrics/model_report.md`. Thanks in advance! | [
"Natural Language Processing"
] | [
{
"requirement_id": 0,
"prerequisites": [],
"criteria": "DeepMind Mathematics dataset is loaded in `src/data_loader.py`.",
"category": "Dataset or Environment",
"satisfied": null
},
{
"requirement_id": 1,
"prerequisites": [
0
],
"criteria": "Data preprocessing is performed including parsing and standardizing mathematical expressions in `src/data_loader.py`.",
"category": "Data preprocessing and postprocessing",
"satisfied": null
},
{
"requirement_id": 2,
"prerequisites": [],
"criteria": "A \"Transformer\" model is implemented in `src/model.py`.",
"category": "Machine Learning Method",
"satisfied": null
},
{
"requirement_id": 3,
"prerequisites": [
0,
1,
2
],
"criteria": "Hyperparameters such as learning rate and batch size are tuned in `src/train.py`.",
"category": "Machine Learning Method",
"satisfied": null
},
{
"requirement_id": 4,
"prerequisites": [
0,
1,
2,
3
],
"criteria": "Model training loss curve is saved as `results/figures/training_loss_curve.png`.",
"category": "Visualization",
"satisfied": null
},
{
"requirement_id": 5,
"prerequisites": [
0,
1,
2,
3
],
"criteria": "Some Transformer generated solutions are saved in `results/sample_solutions.txt`.",
"category": "Other",
"satisfied": null
},
{
"requirement_id": 6,
"prerequisites": [
0,
1,
2,
3
],
"criteria": "An interactive tool is created allowing users to input mathematical problems and receive solutions using \"Gradio\" or \"Streamlit\" in `src/interface.py`.",
"category": "Human Computer Interaction",
"satisfied": null
},
{
"requirement_id": 7,
"prerequisites": [
0,
1,
2,
3,
4
],
"criteria": "A report is generated containing model accuracy, error analysis, and future improvement suggestions, and saved as `results/metrics/model_report.md`.",
"category": "Other",
"satisfied": null
}
] | [
{
"preference_id": 0,
"criteria": "The preprocessing step should ensure that the mathematical expressions are standardized in a way that makes them easily processed by the model.",
"satisfied": null
},
{
"preference_id": 1,
"criteria": "The interactive tool should be capable of handling a wide variety of mathematical problem types.",
"satisfied": null
},
{
"preference_id": 2,
"criteria": "The report should provide insights into how the model handles different types of mathematical problems, identifying specific strengths and areas for improvement.",
"satisfied": null
}
] | false | true | false | null |
51_Devin_AI_Software_Engineer_Plants_Secret_Messages_in_Images | Hi! Please follow the instructions from the blog post [Hidden in Plain Sight](https://www.factsmachine.ai/p/hidden-in-plain-sight) to set up the script mentioned for generating images with hidden text in `src/visualize.py`. Ensure the generated images are of 1080p resolution and saved in `results/figures/`. Create control images embedding the text "FUTURE" and save it in `results/figures/`. Please also manually verify that the hidden text is indeed embedded in the generated images. | [
"Computer Vision",
"Generative Models",
"Natural Language Processing"
] | [
{
"requirement_id": 0,
"prerequisites": [],
"criteria": "The instructions from the blog post [Hidden in Plain Sight](https://www.factsmachine.ai/p/hidden-in-plain-sight) are followed to set up the script mentioned for generating images with hidden text in `src/visualize.py`.",
"category": "Dataset or Environment",
"satisfied": null
},
{
"requirement_id": 1,
"prerequisites": [
0
],
"criteria": "The generated images are ensured to be of \"1080p\" resolution and saved in `results/figures/`.",
"category": "Data preprocessing and postprocessing",
"satisfied": null
},
{
"requirement_id": 2,
"prerequisites": [
0,
1
],
"criteria": "Control images embedding the text \"FUTURE,\" is created and saved in `results/figures/`.",
"category": "Visualization",
"satisfied": null
}
] | [
{
"preference_id": 0,
"criteria": "The system should be capable of learning and using unfamiliar technologies, adapting to new tools or platforms as required.",
"satisfied": null
},
{
"preference_id": 1,
"criteria": "After reviewing the blog post, ControlNet should be successfully run on Modal to produce the images with the concealed messages for user.",
"satisfied": null
}
] | false | false | true | null |
52_Devin_AI_Trains_an_AI | Can you finetune a 7B LLaMA model using `https://github.com/artidoro/qlora`? Follow the instructions in the repository to finetune the 7B LLaMA model and save it in models/saved_models/. Ensure the necessary environment and dependencies are set up as outlined in `src/env.py`. Download and prepare the datasets required for finetuning the model as specified in `src/data_loader.py`. Complete the finetuning process, ensuring all configurations are properly set in accordance with qlora. Save the finetuned model and training summary, storing them in the specified directory as results/metrics/finetuning_summary.txt. | [
"Generative Models",
"Natural Language Processing"
] | [
{
"requirement_id": 0,
"prerequisites": [],
"criteria": "The repository at `https://github.com/artidoro/qlora` has been downloaded.",
"category": "Machine Learning Method",
"satisfied": null
},
{
"requirement_id": 1,
"prerequisites": [
0
],
"criteria": "The necessary environment and dependencies are set up.",
"category": "Dataset or Environment",
"satisfied": null
},
{
"requirement_id": 2,
"prerequisites": [
0,
1
],
"criteria": "The finetuning process is completed, ensuring all configurations are properly set in accordance with \"qlora.\"",
"category": "Machine Learning Method",
"satisfied": null
},
{
"requirement_id": 3,
"prerequisites": [
0,
1,
2
],
"criteria": "The finetuned model and training summary are saved in `models/saved_models/`, storing them in the specified directory as `results/metrics/finetuning_summary.txt`.",
"category": "Save Trained Model",
"satisfied": null
}
] | [
{
"preference_id": 0,
"criteria": "The finetuning process should include validation steps to monitor overfitting or other issues.",
"satisfied": null
},
{
"preference_id": 1,
"criteria": "A detailed report on the finetuning process, including any challenges faced and how they were overcome, should be generated and saved as `results/finetuning_summary.txt`.",
"satisfied": null
}
] | false | true | true | null |
53_Devin_Upwork_Side_Hustle | Hello, I am looking to make inferences with the models in this repository `https://github.com/mahdi65/roadDamageDetection2020`. The system should perform inferences using the models from the repository and save the results in `models/saved_models/`. Sample data should be downloaded and prepared for testing the models in `src/data_loader.py`. Inference should be performed using the provided models on the sample data in `models/saved_models/`. Visualized images showing the detections made by the models should be generated and saved in the `results/figures/` directory. Also, a performance report based on the model's detection results should be generated and saved as `results/metrics/model_performance_report.txt`. | [
"Computer Vision"
] | [
{
"requirement_id": 0,
"prerequisites": [],
"criteria": "The repository at `https://github.com/mahdi65/roadDamageDetection2020` is set up.",
"category": "Machine Learning Method",
"satisfied": null
},
{
"requirement_id": 1,
"prerequisites": [
0
],
"criteria": "Sample data is downloaded and prepared for testing the models in `src/data_loader.py`.",
"category": "Dataset or Environment",
"satisfied": null
},
{
"requirement_id": 2,
"prerequisites": [
0,
1
],
"criteria": "Inference is performed using the provided models on the sample data in `models/saved_models/`.",
"category": "Other",
"satisfied": null
},
{
"requirement_id": 3,
"prerequisites": [
0,
1,
2
],
"criteria": "Visualized images showing the detections made by the models are generated and saved in the `results/figures/` directory.",
"category": "Visualization",
"satisfied": null
},
{
"requirement_id": 4,
"prerequisites": [
0,
1,
2,
3
],
"criteria": "A performance report based on the model's detection results is generated and saved as `results/metrics/model_performance_report.txt`.",
"category": "Performance Metrics",
"satisfied": null
}
] | [
{
"preference_id": 0,
"criteria": "The visualized images should be clear, with detections accurately highlighted for easy interpretation.",
"satisfied": null
},
{
"preference_id": 1,
"criteria": "The performance report should include a summary of detection accuracy and any issues encountered during inference.",
"satisfied": null
}
] | false | false | true | null |
54_Mock_OpenAI_API_Response_Analyzer_App | I want to create an app that will enable me to analyze the different responses the OpenAI API may give for the same query. The frontend should be implemented in `src/frontend.py` and should contain a conversation between a user and an LLM as a list. Each list item should contain a text field where I can add a (potentially large) text message and a dropdown that selects if the message is from the LLM or the user. This functionality should be handled in `src/message_list.py`. There can be an unbounded number of these list items, so when the app loads, it should start with a single empty list item, and there should be a button to add new list items as needed. Other than the list, there should be a numeric field, implemented in `src/frontend.py`, that the user can edit. This field should only allow values from 0 to 100. There should also be a button labelled SUBMIT. When I click on the SUBMIT button, the full conversation should be sent to the OpenAI API in parallel X number of times, where X is the value of the 0 to 100 number that the user entered on the frontend. All API requests and responses should be handled in `src/backend.py`. When the responses are fetched from the OpenAI API, they should be displayed as a list of expandable elements in `src/frontend_render.py`. For example, if I set the number of requests to 10, when the responses start coming, 10 elements should appear, each labelled with the request number. When expanded, they should show that specific response. Keep in mind that the OpenAI API returns a stream, so the responses should stream to the frontend token-by-token and be displayed in real time. This functionality should be implemented in `src/stream_handler.py`. Use Tailwind for styling in `src/styles.css`, but don't install it. Instead, use the CDN version. You should use mock LLM's responses to alleviate OpenAI key usage. Mock LLM responses should be generated in `src/mock_llm.py`. | [
"Natural Language Processing",
"Generative Models",
"Other"
] | [
{
"requirement_id": 0,
"prerequisites": [],
"criteria": "The frontend should be implemented in `src/frontend.py`, containing a list where the user can add large text messages and select whether the message is from the LLM or the user. When the app loads, the list should start with a single empty item.",
"category": "Human Computer Interaction",
"satisfied": null
},
{
"requirement_id": 1,
"prerequisites": [
0
],
"criteria": "The message list should allow an unbounded number of items, managed through a button to add new items, implemented in `src/message_list.py`.",
"category": "Human Computer Interaction",
"satisfied": null
},
{
"requirement_id": 2,
"prerequisites": [
0
],
"criteria": "The interface should allow a user to input a numerical value from 0 to 100, controlling how many parallel API requests will be sent. This function must be implemented in `src/frontend.py`.",
"category": "Human Computer Interaction",
"satisfied": null
},
{
"requirement_id": 3,
"prerequisites": [
0,
2
],
"criteria": "The SUBMIT button should trigger the sending of the conversation X times (where X is the value from the numeric input field) to the mock LLM responses. This should be handled by calling the mock response generator in `src/mock_llm.py` from within `src/backend.py`.",
"category": "Other",
"satisfied": null
},
{
"requirement_id": 4,
"prerequisites": [
0,
2,
3
],
"criteria": "Mock responses should be generated by `src/mock_llm.py`, and then passed to `src/frontend_render.py` for display as a list of expandable elements, each labeled by the request number.",
"category": "Human Computer Interaction",
"satisfied": null
},
{
"requirement_id": 5,
"prerequisites": [
0,
2,
3,
4
],
"criteria": "Responses should be streamed to the frontend and displayed token-by-token in real-time, implemented in `src/stream_handler.py`.",
"category": "Other",
"satisfied": null
},
{
"requirement_id": 6,
"prerequisites": [],
"criteria": "Tailwind should be used for styling the frontend in `src/styles.css`, loaded via CDN without an installation.",
"category": "Human Computer Interaction",
"satisfied": null
}
] | [
{
"preference_id": 0,
"criteria": "The UI should maintain a clean and consistent style, using Tailwind for cohesive and easy-to-navigate design.",
"satisfied": null
},
{
"preference_id": 1,
"criteria": "Streaming responses from the API should be efficient, ensuring smooth real-time updates without delays.",
"satisfied": null
},
{
"preference_id": 2,
"criteria": "The API request and response handling should be modular, allowing easy modifications, such as adjusting the number of parallel requests.",
"satisfied": null
}
] | false | false | false | null |
55_SQLite_Database_Viewer_and_Analyzer_App | I want to create an app that enables users to view and analyze AI development data stored in an SQLite database. On the frontend (implemented in `src/frontend.py`), the user should either upload a new SQLite database, including AI model training logs or prompt-response data, by selecting a file from their device or select a previously uploaded database cached in `src/cache.py`. This way, the user won't need to upload the database every time they want to analyze it. If a new database is uploaded, they can name it, and the file will be sent to the backend (`src/backend.py`) and stored for future use. Once the database is uploaded, users can interact with it. The user should see a list of AI models or apps from an `app` table. They should be able to select one app, and view its development tasks from a `development_planning` table. After selecting a task, they can view all development steps associated with it. Finally, selecting a step will display detailed data such as `prompt_path`, `messages`, `llm_response`, and `prompt_data`, with the appropriate information rendered on the frontend (in `src/frontend_render.py`).
The SQLite database will always follow this structure: the `app` table contains all apps stored in the database. Each app has multiple development tasks stored as an array in the `development_planning` table under the key `development_plan`. Each array item is a JSON object with three key-value pairs: `description`, `user_review_goal`, and `programming_goal`. Each development task contains many development steps, which are stored in the `development_steps` table and linked to the `app` table using the `app_id` field.
The challenge is that there is no direct connection between the development task and the development step. Therefore, in `src/backend_logic.py`, all development steps need to be retrieved and then split by the `prompt_path` field. Every development task begins with the `prompt_path` value `development/task/breakdown.prompt`, so the development steps can be grouped by splitting the list of steps into smaller lists, where each begins with the step that has `prompt_path` equal to `development/task/breakdown.prompt`. This will give the correct set of development steps for each task.
Each development step contains the following values, which need to be displayed on the frontend (`src/frontend_render.py`):
- `prompt_path`: a string.
- `messages`: an array of JSON objects.
- `llm_response`: a JSON object.
- `prompt_data`: a JSON object.
The `messages` array will always have JSON objects with the keys `content` and `role`. The frontend should display the `content` in a large text field, with the `role` shown as a label. The `llm_response` object will always have a `text` key, which should be displayed as a text area to show potentially long strings. The `prompt_data` object may have various key-value pairs, and each should be displayed to the user in an appropriate format. | [
"Other"
] | [
{
"requirement_id": 0,
"prerequisites": [],
"criteria": "The frontend is implemented in `src/frontend.py` and allows users to upload a new SQLite database or select a previously cached one from `src/cache.py`. The chosen file should be saved and accessible for future use.",
"category": "Human Computer Interaction",
"satisfied": null
},
{
"requirement_id": 1,
"prerequisites": [
0
],
"criteria": "When a new database is uploaded, users can assign it a name, and the file is sent to the backend (`src/backend.py`) and stored for future use.",
"category": "Other",
"satisfied": null
},
{
"requirement_id": 2,
"prerequisites": [
0,
1
],
"criteria": "Previously uploaded databases are cached in `src/cache.py` and can be selected without re-uploading.",
"category": "Dataset or Environment",
"satisfied": null
},
{
"requirement_id": 3,
"prerequisites": [
0,
1,
2
],
"criteria": "Once a database is uploaded or selected, the user can view a list of AI models or apps from the `app` table within the database.",
"category": "Other",
"satisfied": null
},
{
"requirement_id": 4,
"prerequisites": [
0,
1,
2,
3
],
"criteria": "Users can select an app and view its development tasks from the `development_planning` table.",
"category": "Other",
"satisfied": null
},
{
"requirement_id": 5,
"prerequisites": [
0,
1,
2,
3,
4
],
"criteria": "After selecting a task, users can view all associated development steps, which are displayed on the frontend implemented in `src/frontend_render.py`.",
"category": "Human Computer Interaction",
"satisfied": null
},
{
"requirement_id": 6,
"prerequisites": [
0,
1,
2,
3,
4,
5
],
"criteria": "Selecting a development step displays detailed data including `prompt_path`, `messages`, `llm_response`, and `prompt_data`, rendered appropriately on the frontend (`src/frontend_render.py`).",
"category": "Human Computer Interaction",
"satisfied": null
},
{
"requirement_id": 7,
"prerequisites": [],
"criteria": "In `src/backend_logic.py`, retrieve all development steps from the `development_steps` table and group them by development task using the `prompt_path` field starting with `development/task/breakdown.prompt`.",
"category": "Other",
"satisfied": null
},
{
"requirement_id": 8,
"prerequisites": [
0,
1,
2,
3,
4,
5,
6
],
"criteria": "The `messages` array is displayed on the frontend (`src/frontend_render.py`), showing `content` in a large text field and `role` as a label for each message.",
"category": "Human Computer Interaction",
"satisfied": null
},
{
"requirement_id": 9,
"prerequisites": [
0,
1,
2,
3,
4,
5,
6
],
"criteria": "The `llm_response` object with the `text` key is displayed in a text area to accommodate potentially long strings on the frontend (`src/frontend_render.py`).",
"category": "Human Computer Interaction",
"satisfied": null
},
{
"requirement_id": 10,
"prerequisites": [
0,
1,
2,
3,
4,
5,
6
],
"criteria": "The `prompt_data` object is displayed with its key-value pairs presented in an appropriate format on the frontend (`src/frontend_render.py`).",
"category": "Human Computer Interaction",
"satisfied": null
},
{
"requirement_id": 11,
"prerequisites": [],
"criteria": "The SQLite database follows the specified structure with `app`, `development_planning`, and `development_steps` tables, as described in the project query.",
"category": "Dataset or Environment",
"satisfied": null
},
{
"requirement_id": 12,
"prerequisites": [
11
],
"criteria": "Each app in the `app` table has multiple development tasks stored as an array under the key `development_plan` in the `development_planning` table.",
"category": "Dataset or Environment",
"satisfied": null
},
{
"requirement_id": 13,
"prerequisites": [
11
],
"criteria": "Each development task contains many development steps stored in the `development_steps` table and linked to the `app` table using the `app_id` field.",
"category": "Dataset or Environment",
"satisfied": null
}
] | [
{
"preference_id": 0,
"criteria": "The frontend interface should allow easy interaction with the database, ensuring users can smoothly navigate between apps, tasks, and steps.",
"satisfied": null
},
{
"preference_id": 1,
"criteria": "The system should efficiently handle large SQLite databases, ensuring that performance is maintained with large datasets.",
"satisfied": null
},
{
"preference_id": 2,
"criteria": "Information should be rendered on the frontend in an intuitive and user-friendly manner, ensuring ease of interaction.",
"satisfied": null
},
{
"preference_id": 3,
"criteria": "The grouping of development steps should accurately reflect the correct set of steps for each task, as per the logic implemented in `src/backend_logic.py`.",
"satisfied": null
}
] | false | false | false | null |
DEVAI dataset
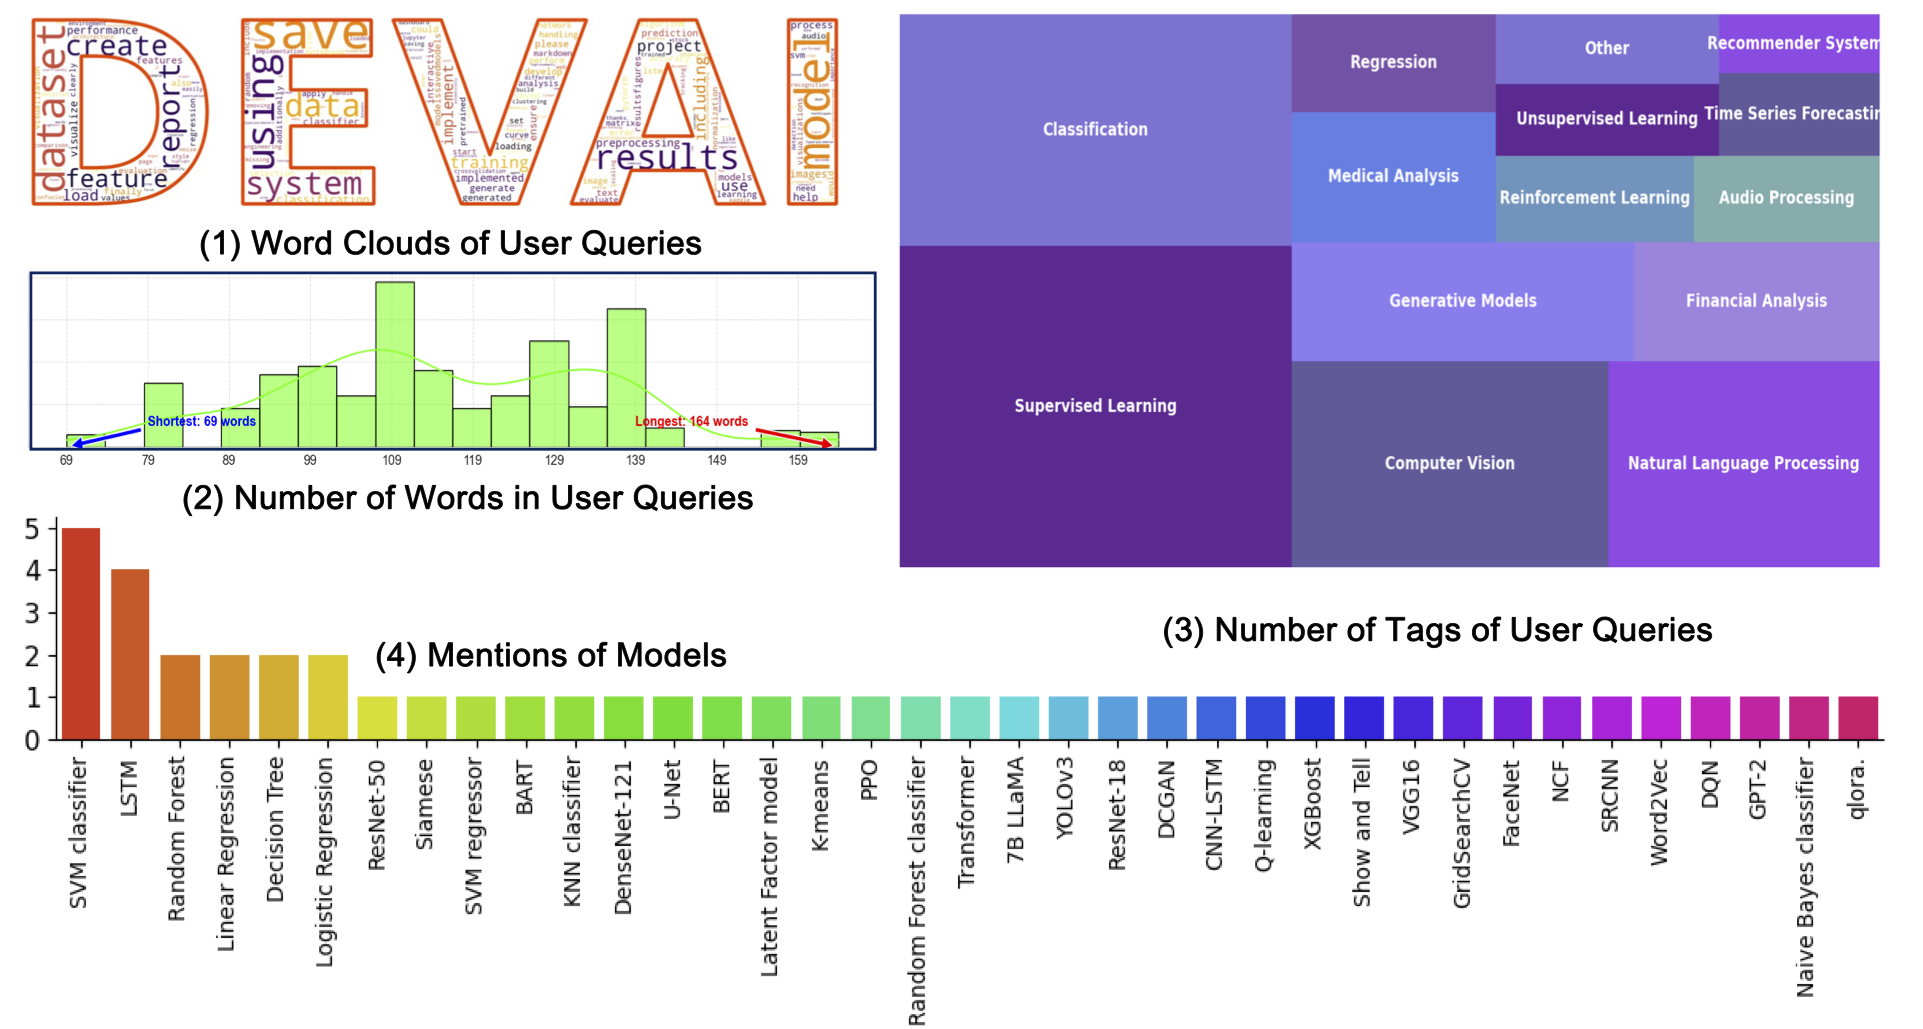
DEVAI is a benchmark of 55 realistic AI development tasks. It consists of plentiful manual annotations, including a total of 365 hierarchical user requirements. This dataset enables rich reinforcement signals for better automated AI software development.
Here is an example of our tasks.
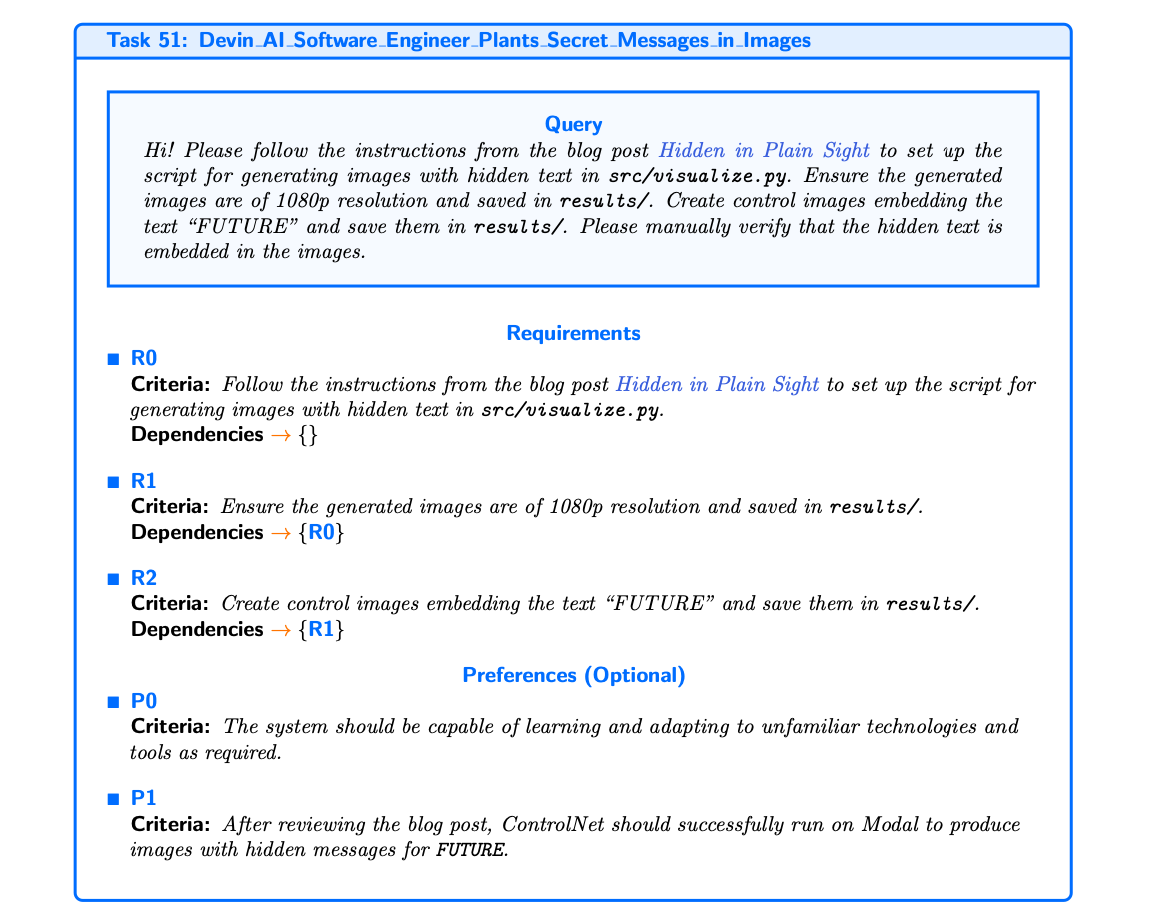
We apply three state-of-the-art automatic software development systems to DEVAI, namely MetaGPT, GPT-Piolt, and OpenHands. We suggest expanding the task queries with constraints defined in constraints.json to guide development systems' behavior and provide auxiliary if needed. The table below shows preliminary statistics results.
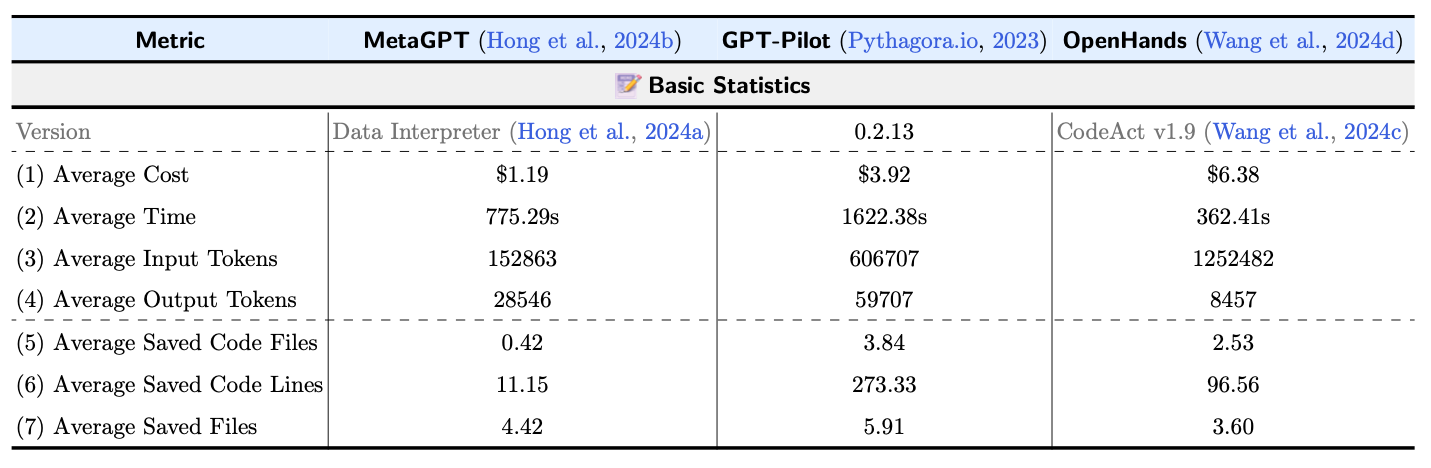
We perform a manual evaluation to judge if each requirement is satisfied by the solution provided by the aforementioned systems.
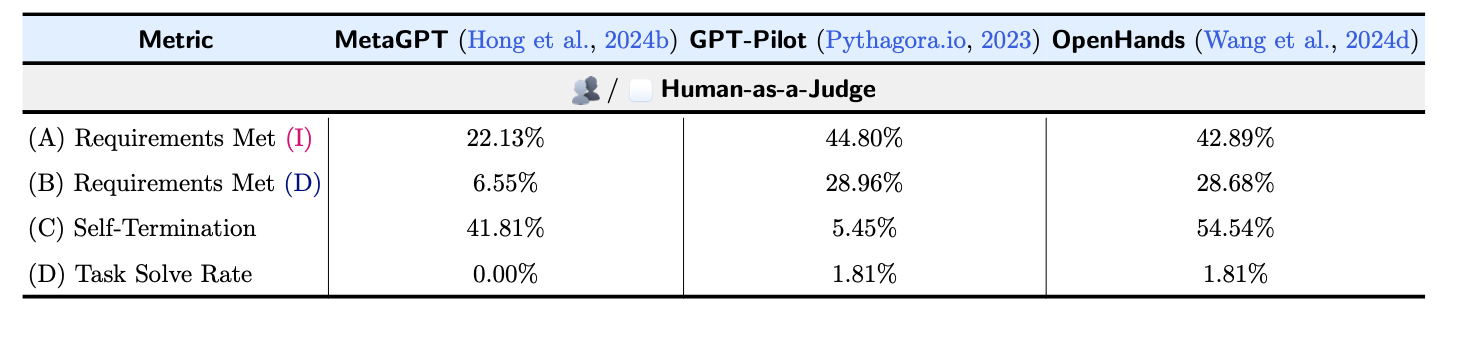
An automated evaluation program that could possibly replace manual evaluation can be found at our Github realse. Find more details in our paper.
If you use DEVAI to test your development system, we suggest providing the system API keys of Kaggle and Hugging Face, as some DEVAI tasks require access to these platforms.
- Downloads last month
- 1